Interactive Learning Analytics with AI
Transform student data into engaging visual stories that enhance learning outcomes. Create interactive educational charts, track progress patterns, and help students discover insights through hands-on data exploration that makes abstract concepts tangible.
Get Started for Free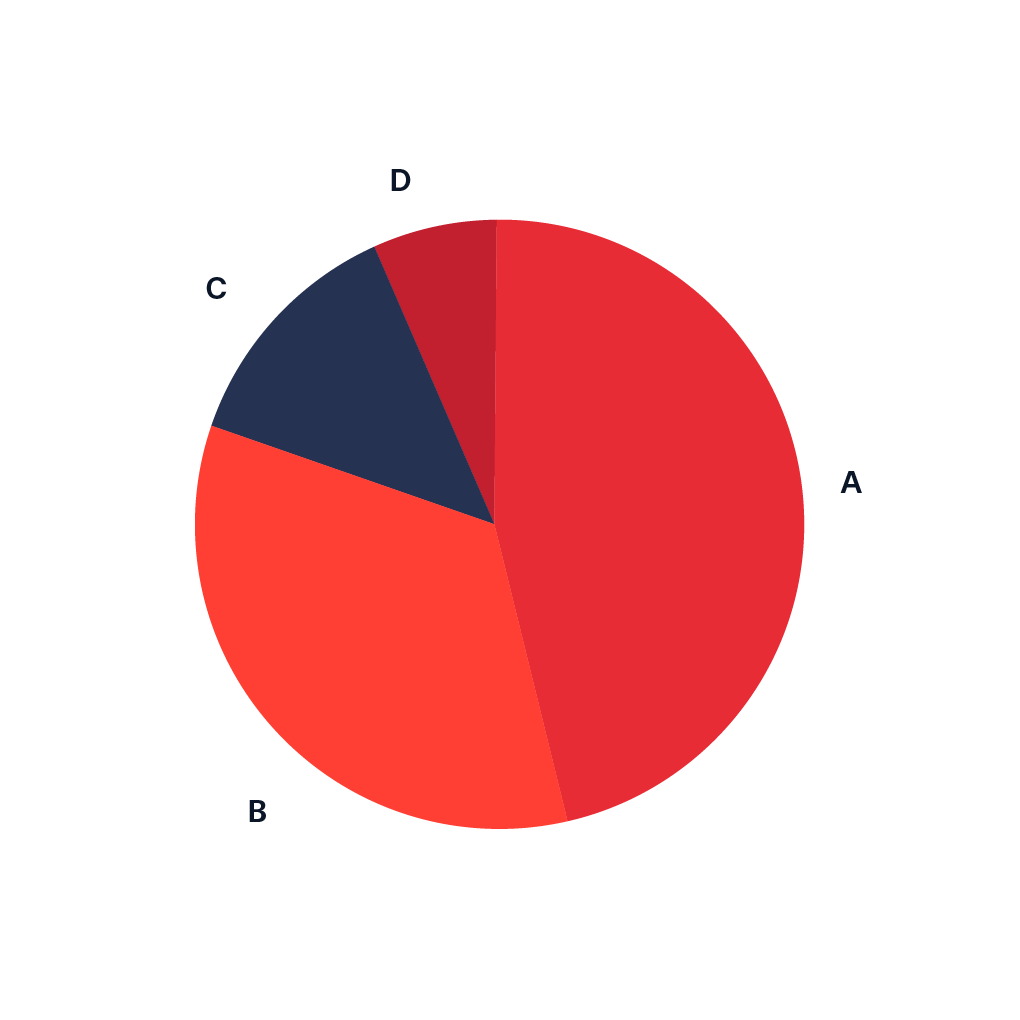
Educational Data Visualizations
Interactive educational charts and analytics that enhance learning outcomes and student engagement.
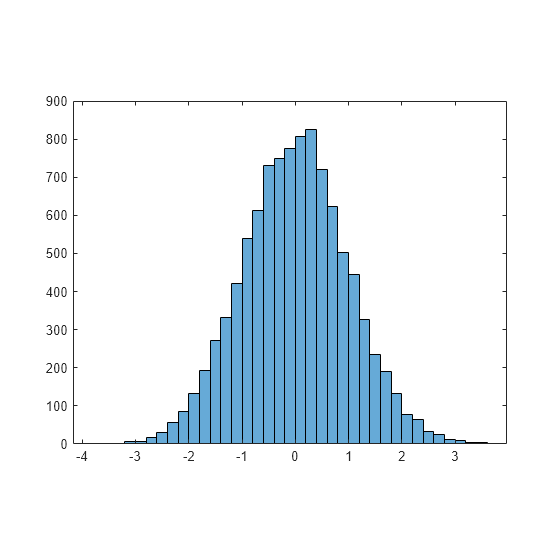
Student Performance Analysis
Analyze test score distributions to identify learning patterns and adjust teaching strategies.
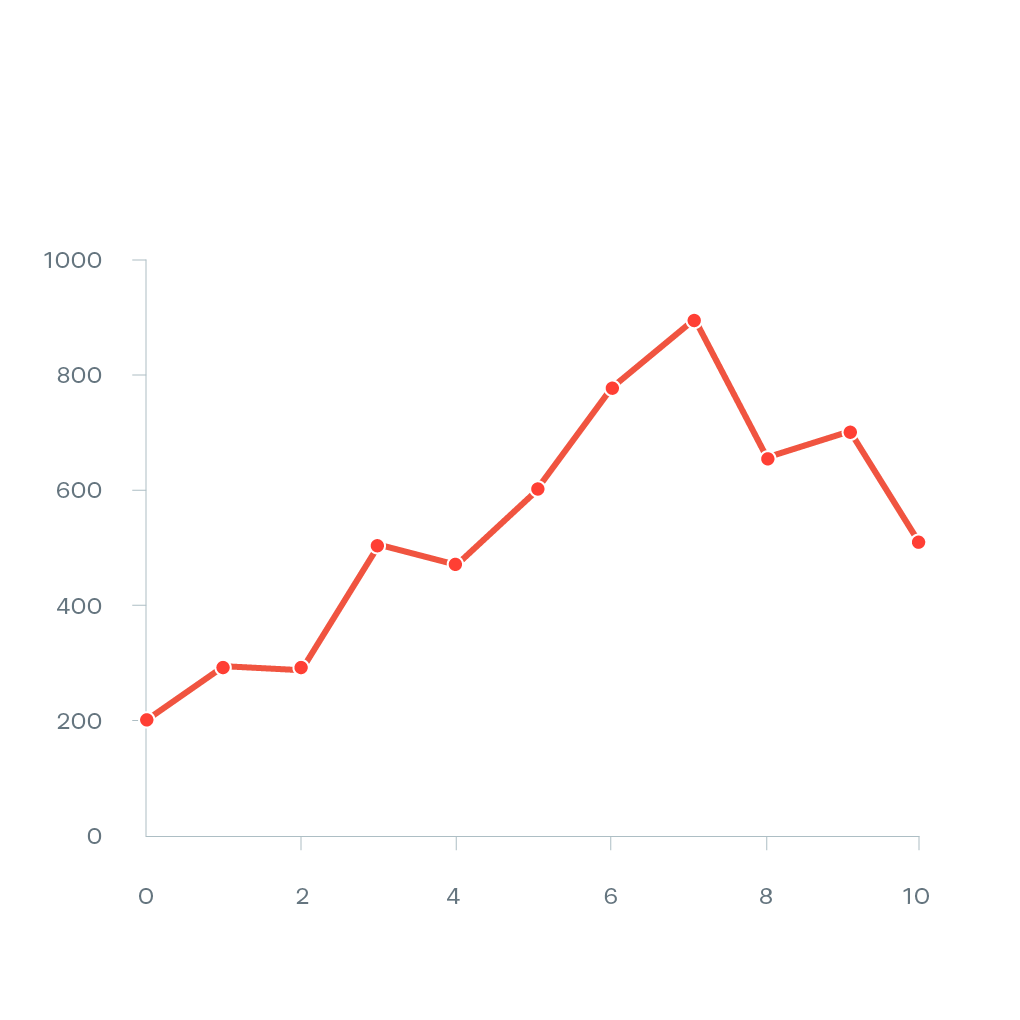
Progress Tracking
Monitor individual student improvement and identify intervention opportunities early.
Curriculum Planning
Optimize class time allocation and balance subject coverage for better learning outcomes.
Subject Mastery
Compare student performance across topics to identify strengths and areas needing focus.
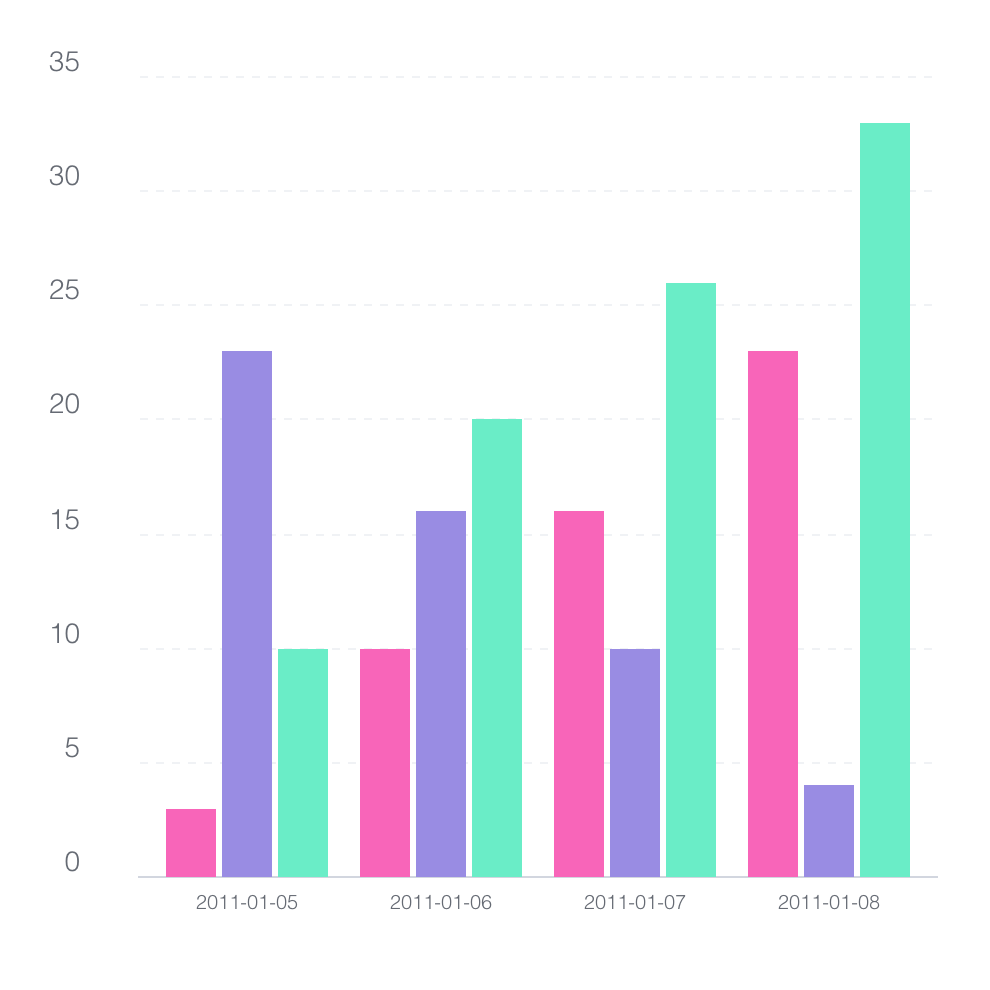
Attendance Analytics
Identify attendance patterns and seasonal trends to improve student engagement strategies.
Skills Assessment
Comprehensive student skill profiles across multiple competencies for personalized learning.
Success Story: Lincoln Elementary
"Since implementing Vizionary's interactive learning analytics, our 5th-grade math scores improved by 34% in just one semester. Students are now excited about data and actively participate in analyzing their own learning patterns."
— Sarah Mitchell, Math Teacher & Data Coordinator
Ready to Transform Your Classroom with Data?
Join thousands of educators who use Vizionary to create engaging, data-driven learning experiences that improve student outcomes.
Start Teaching with DataReal Educational Applications
Discover how educators worldwide use Vizionary to create engaging learning experiences and drive measurable student success.
Student Progress Tracking
Visualize individual and class-wide learning progression with interactive timeline charts that identify struggling students early.
Concept Visualization
Transform abstract mathematical and scientific concepts into interactive visual experiences that improve comprehension rates.
Assessment Analytics
Analyze test scores, assignment patterns, and learning gaps with detailed performance dashboards and predictive insights.
Classroom Management
Track attendance patterns, participation rates, and behavioral trends to optimize classroom dynamics and engagement.
Real-Time Feedback
Create live polling visualizations and instant feedback loops that keep students engaged and informed about their progress.
Curriculum Insights
Map learning objectives to student outcomes with comprehensive curriculum effectiveness visualizations and standards alignment.