•3 min read
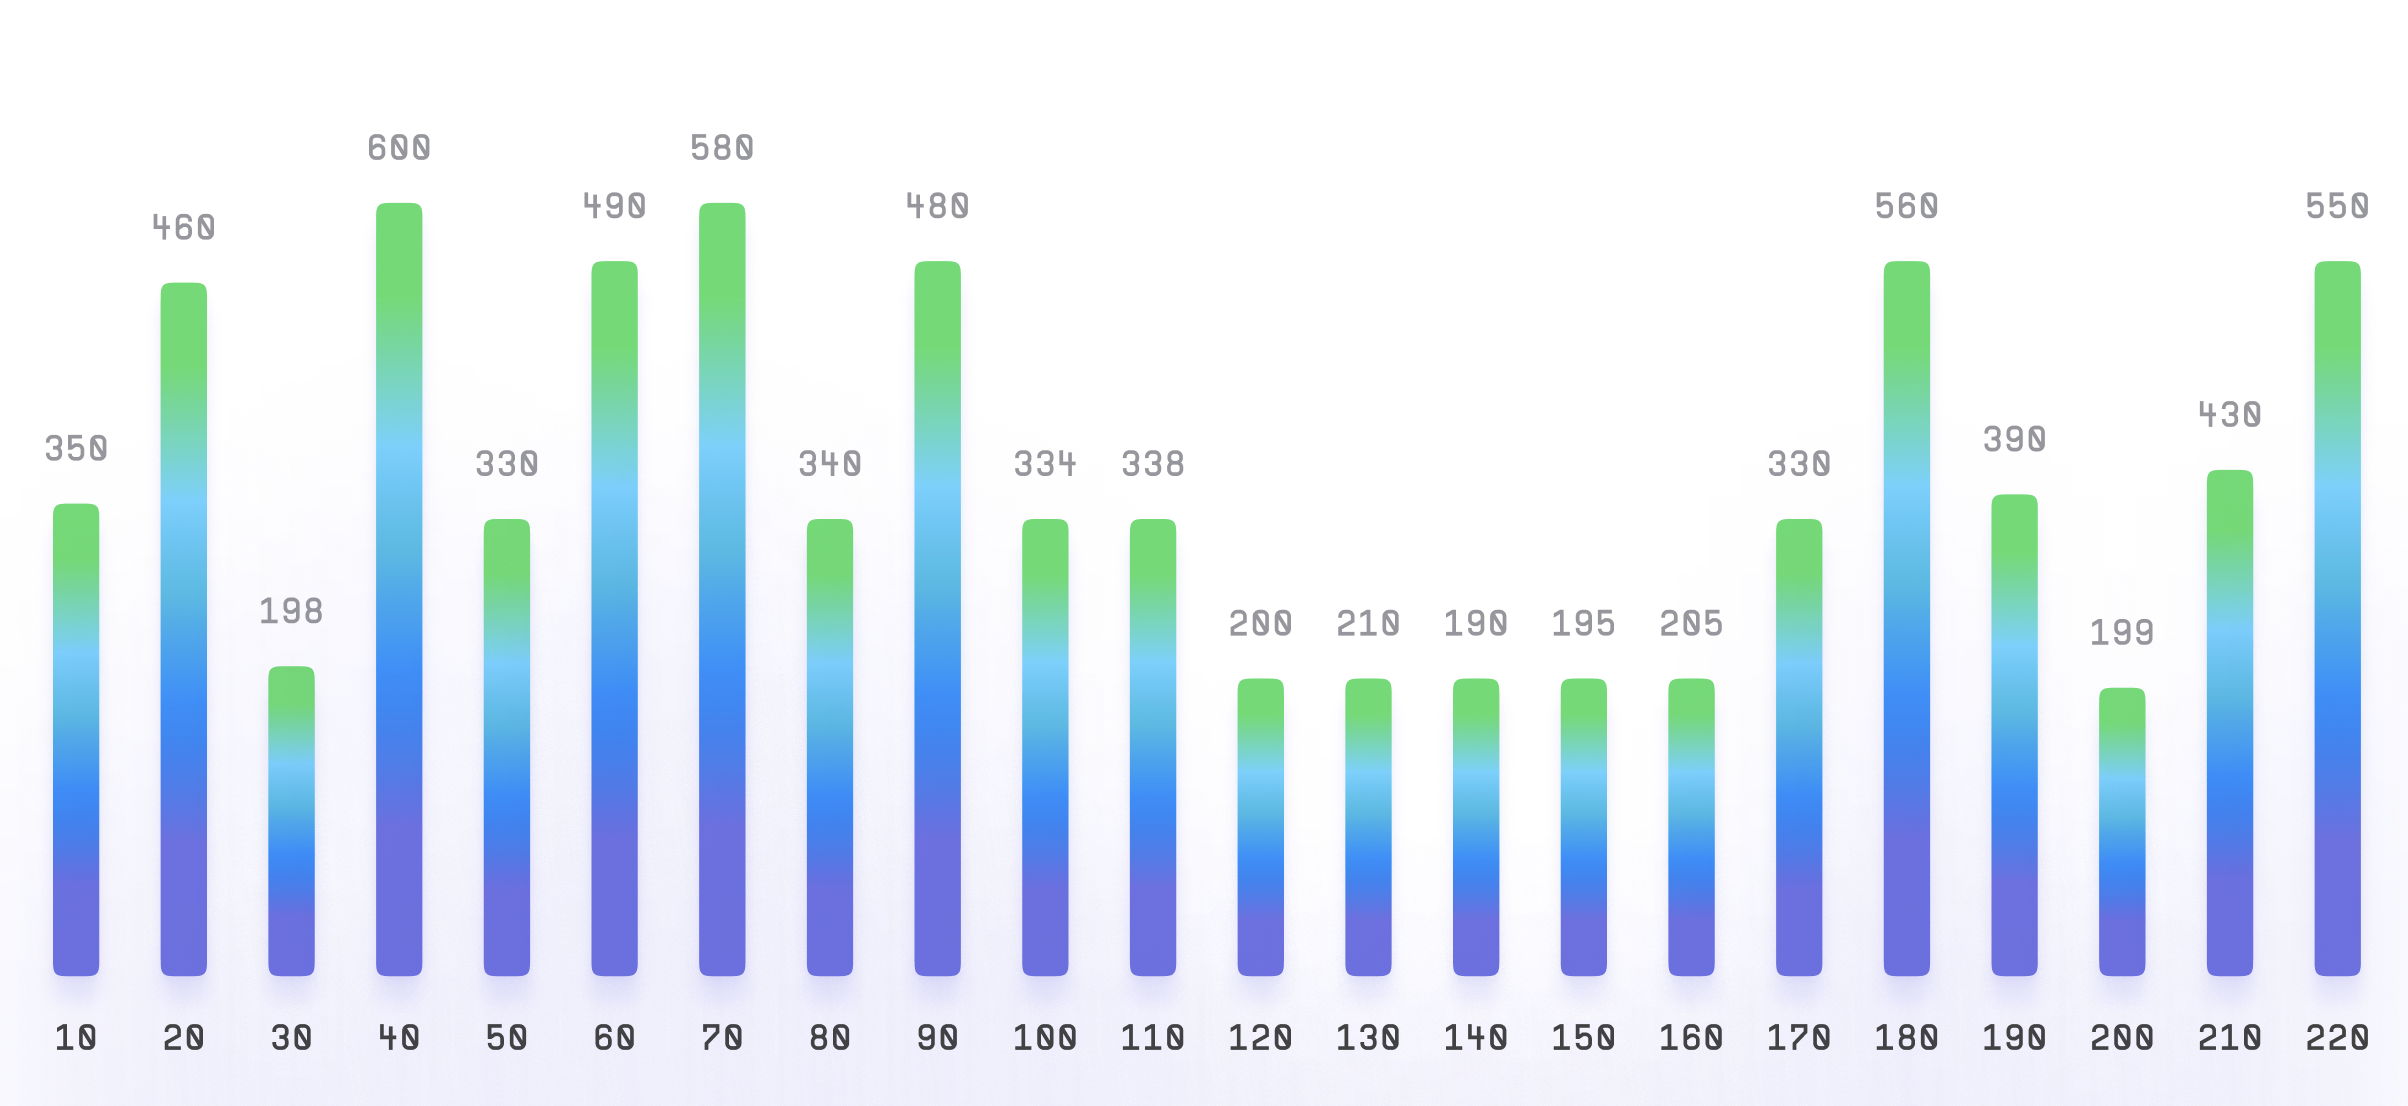
Bar Chart
Bar chart, also known as a bar graph, is a type of chart used to display data using rectangular bars. It is commonly use...
Read More
Learn how to create effective charts and visualizations with our comprehensive guides and tutorials.
Bar chart, also known as a bar graph, is a type of chart used to display data using rectangular bars. It is commonly use...
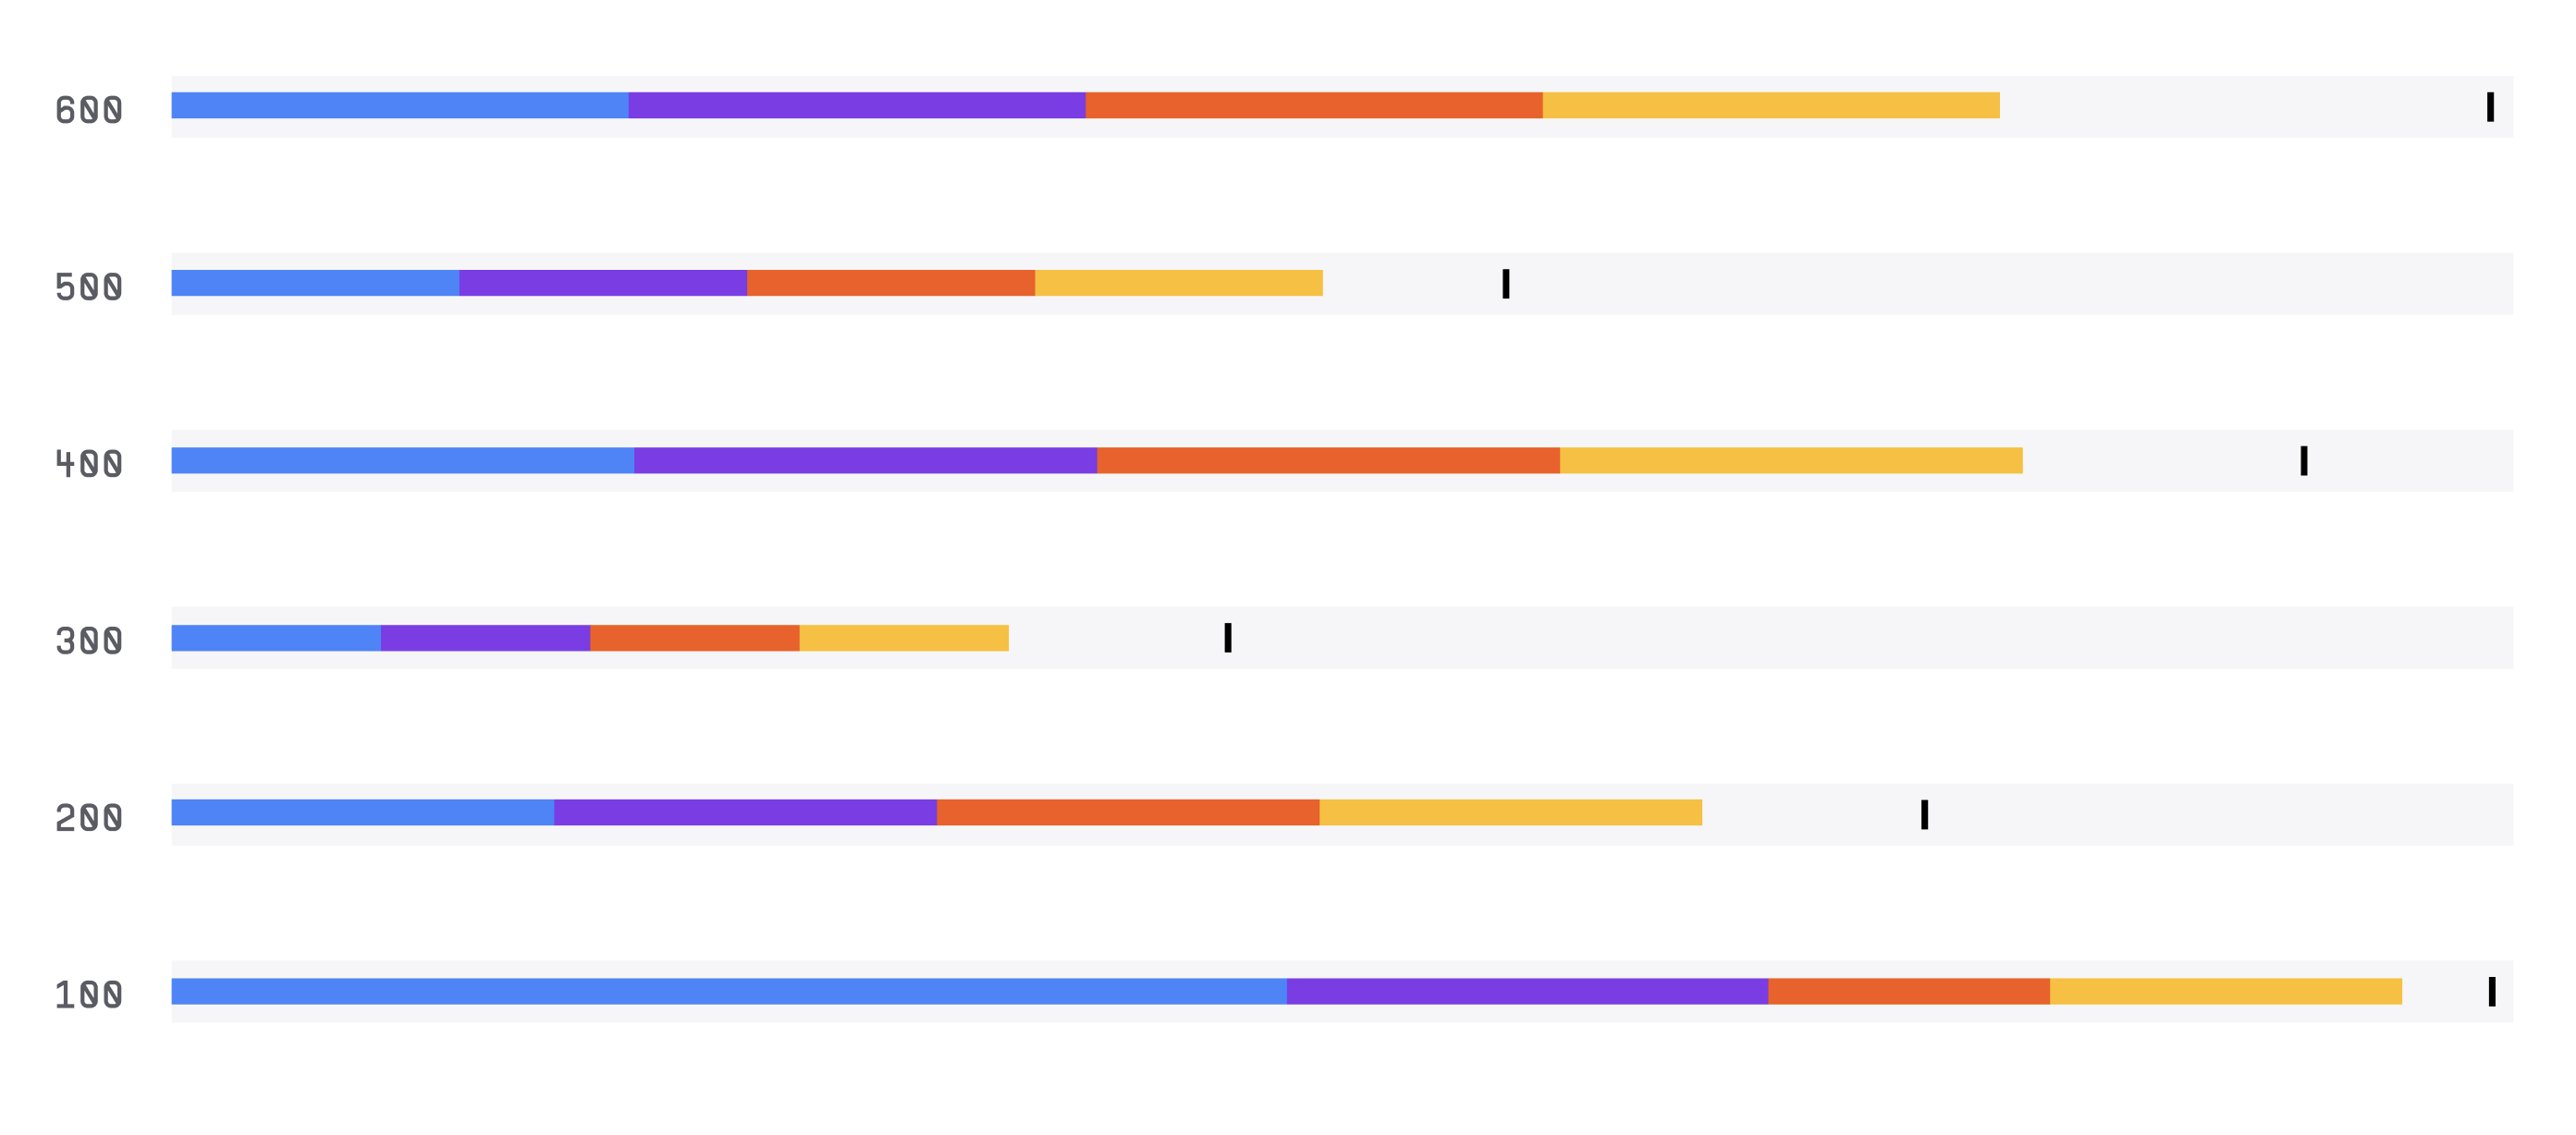
The Bullet Graph is a data visualization chart that is used to display a single measure along with a target value and ot...
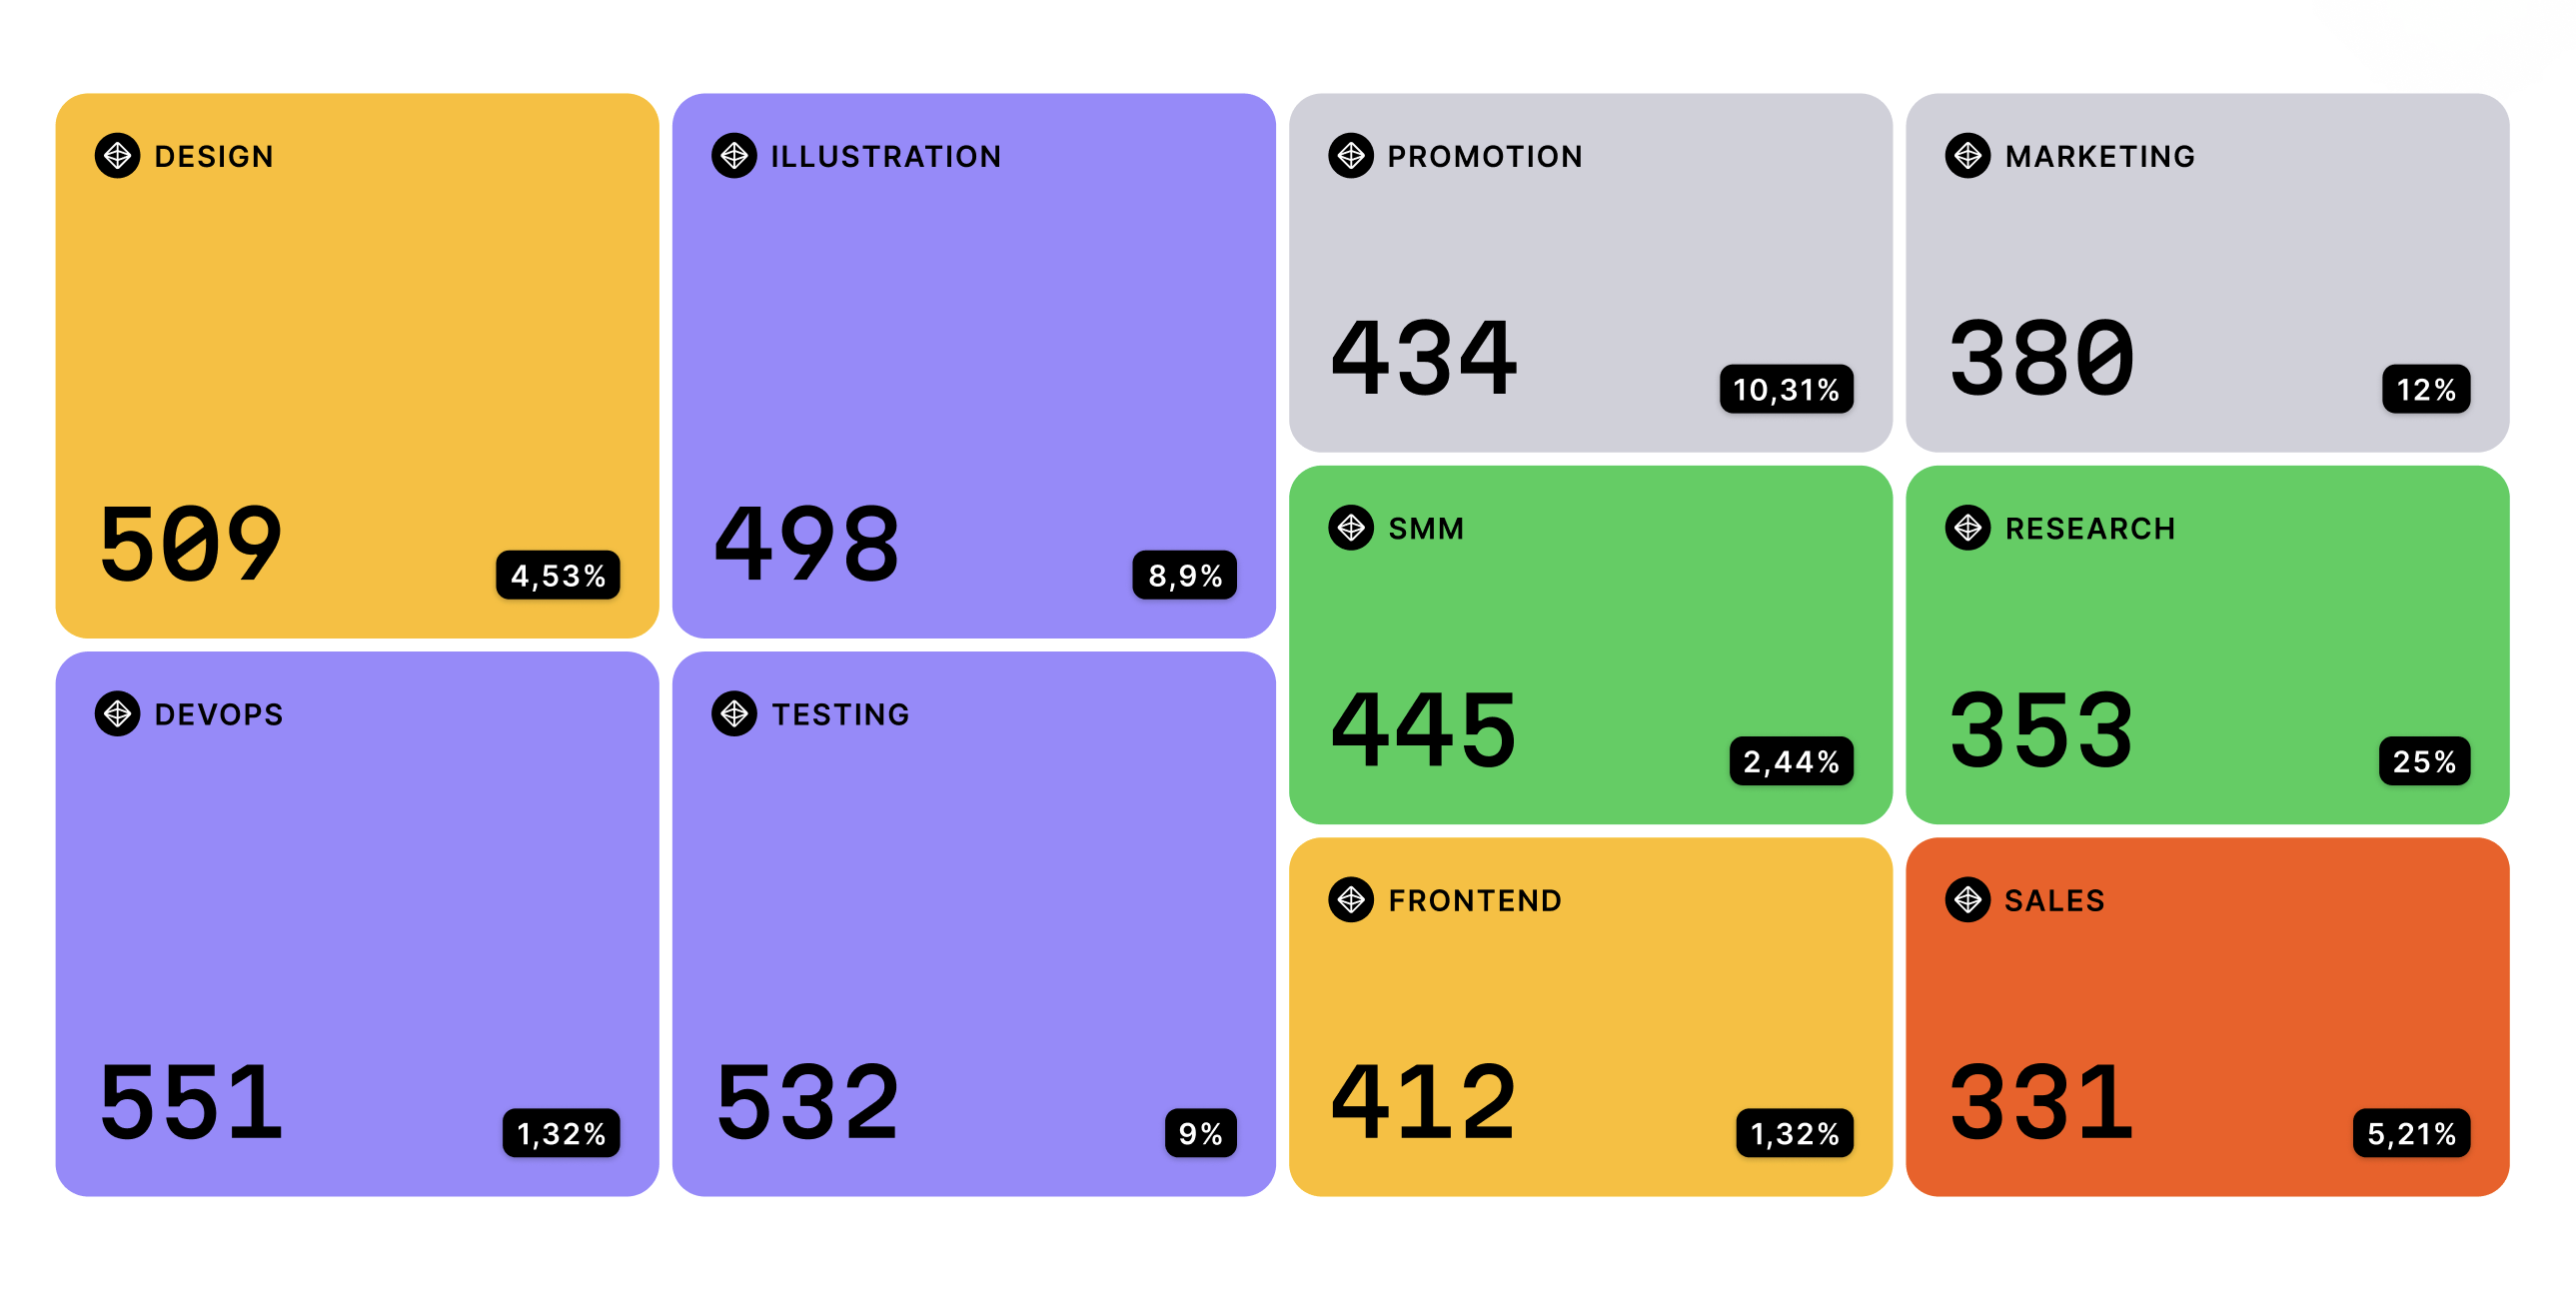
Treemap Chart is a data visualization chart that is used to display hierarchical data in a rectangular format. It is oft...
Tree Chart or Tree Graph is a data visualization chart that is used to display hierarchical data in a tree-like structur...
Sunburst Chart is a data visualization chart that is used to display hierarchical data in a circular format. It is simil...
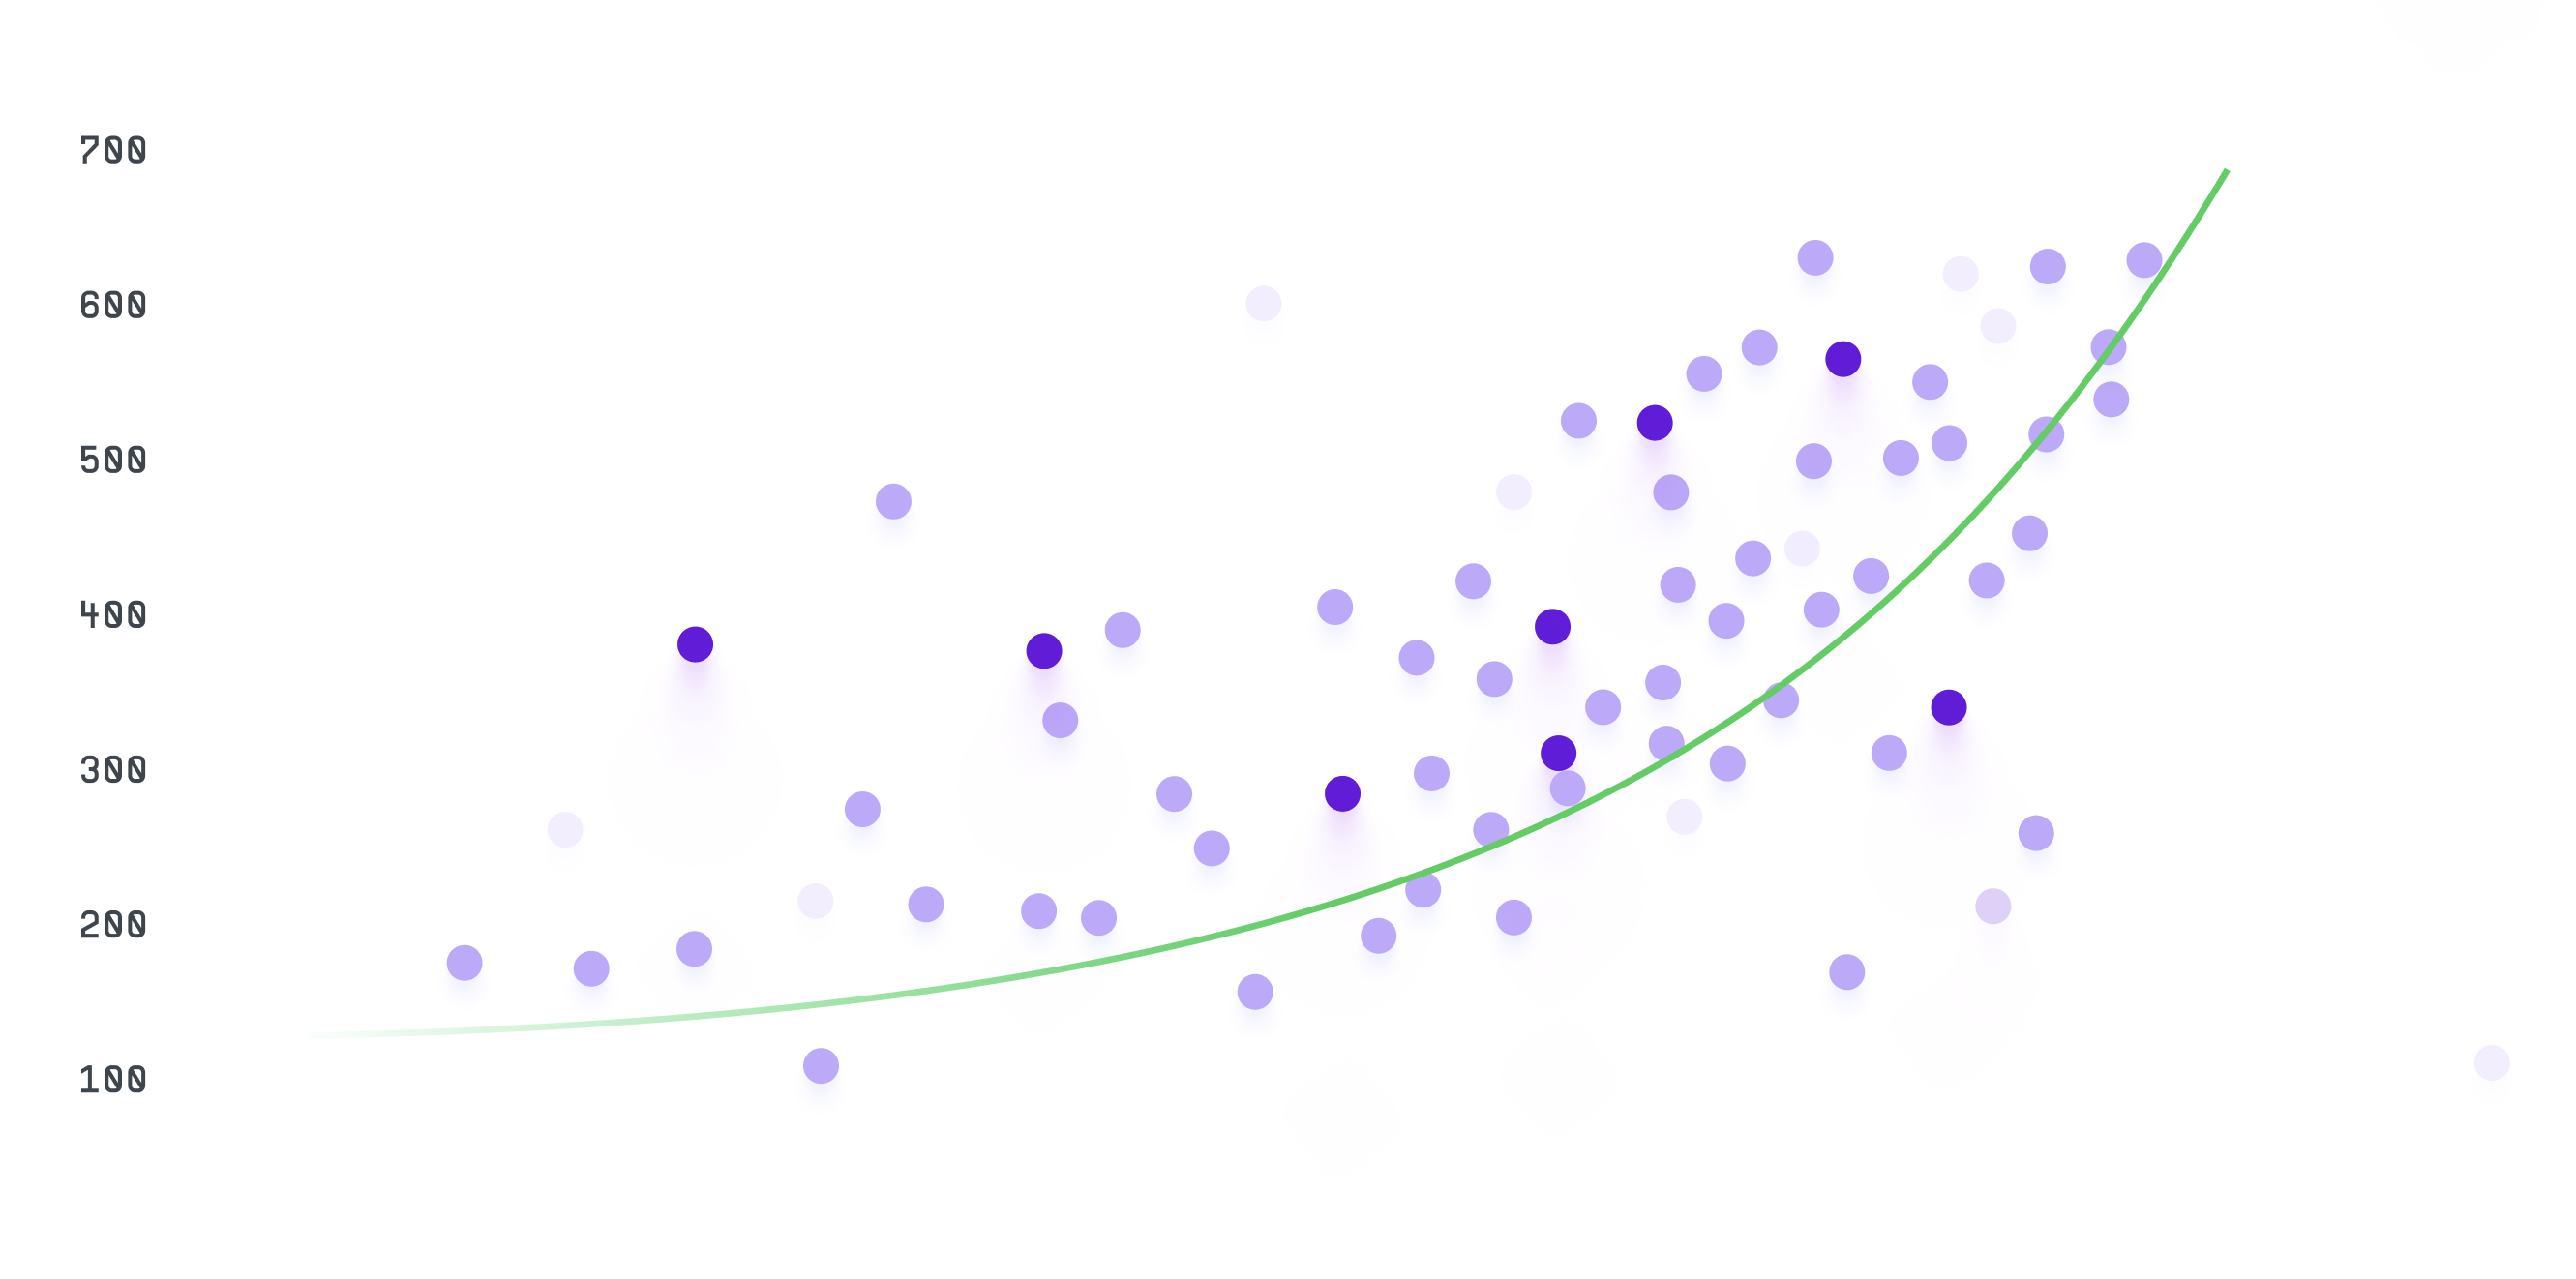
Scatter chart, also known as a scatter plot or scatter graph, is a type of chart used to display the relationship betwee...
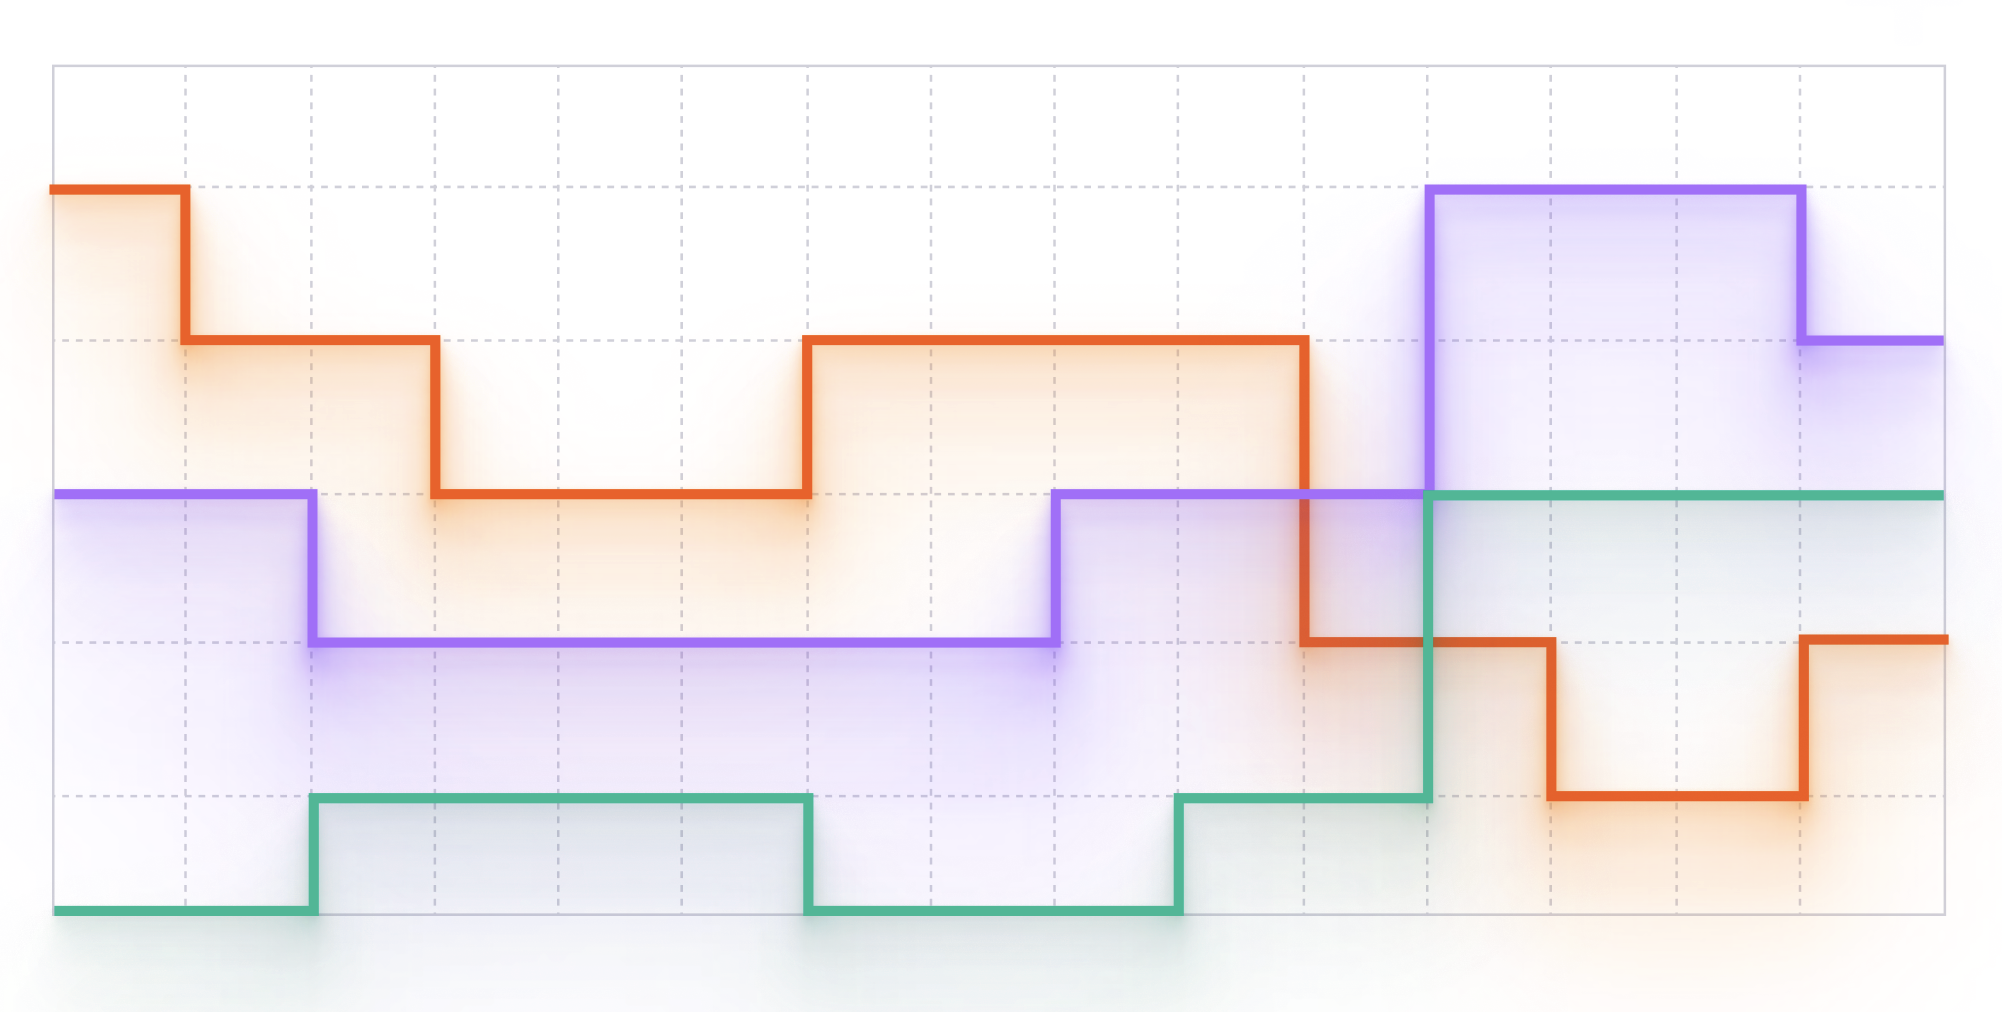
Stepped line graph, also called a step chart, is a type of chart used to display data that changes abruptly at certain i...
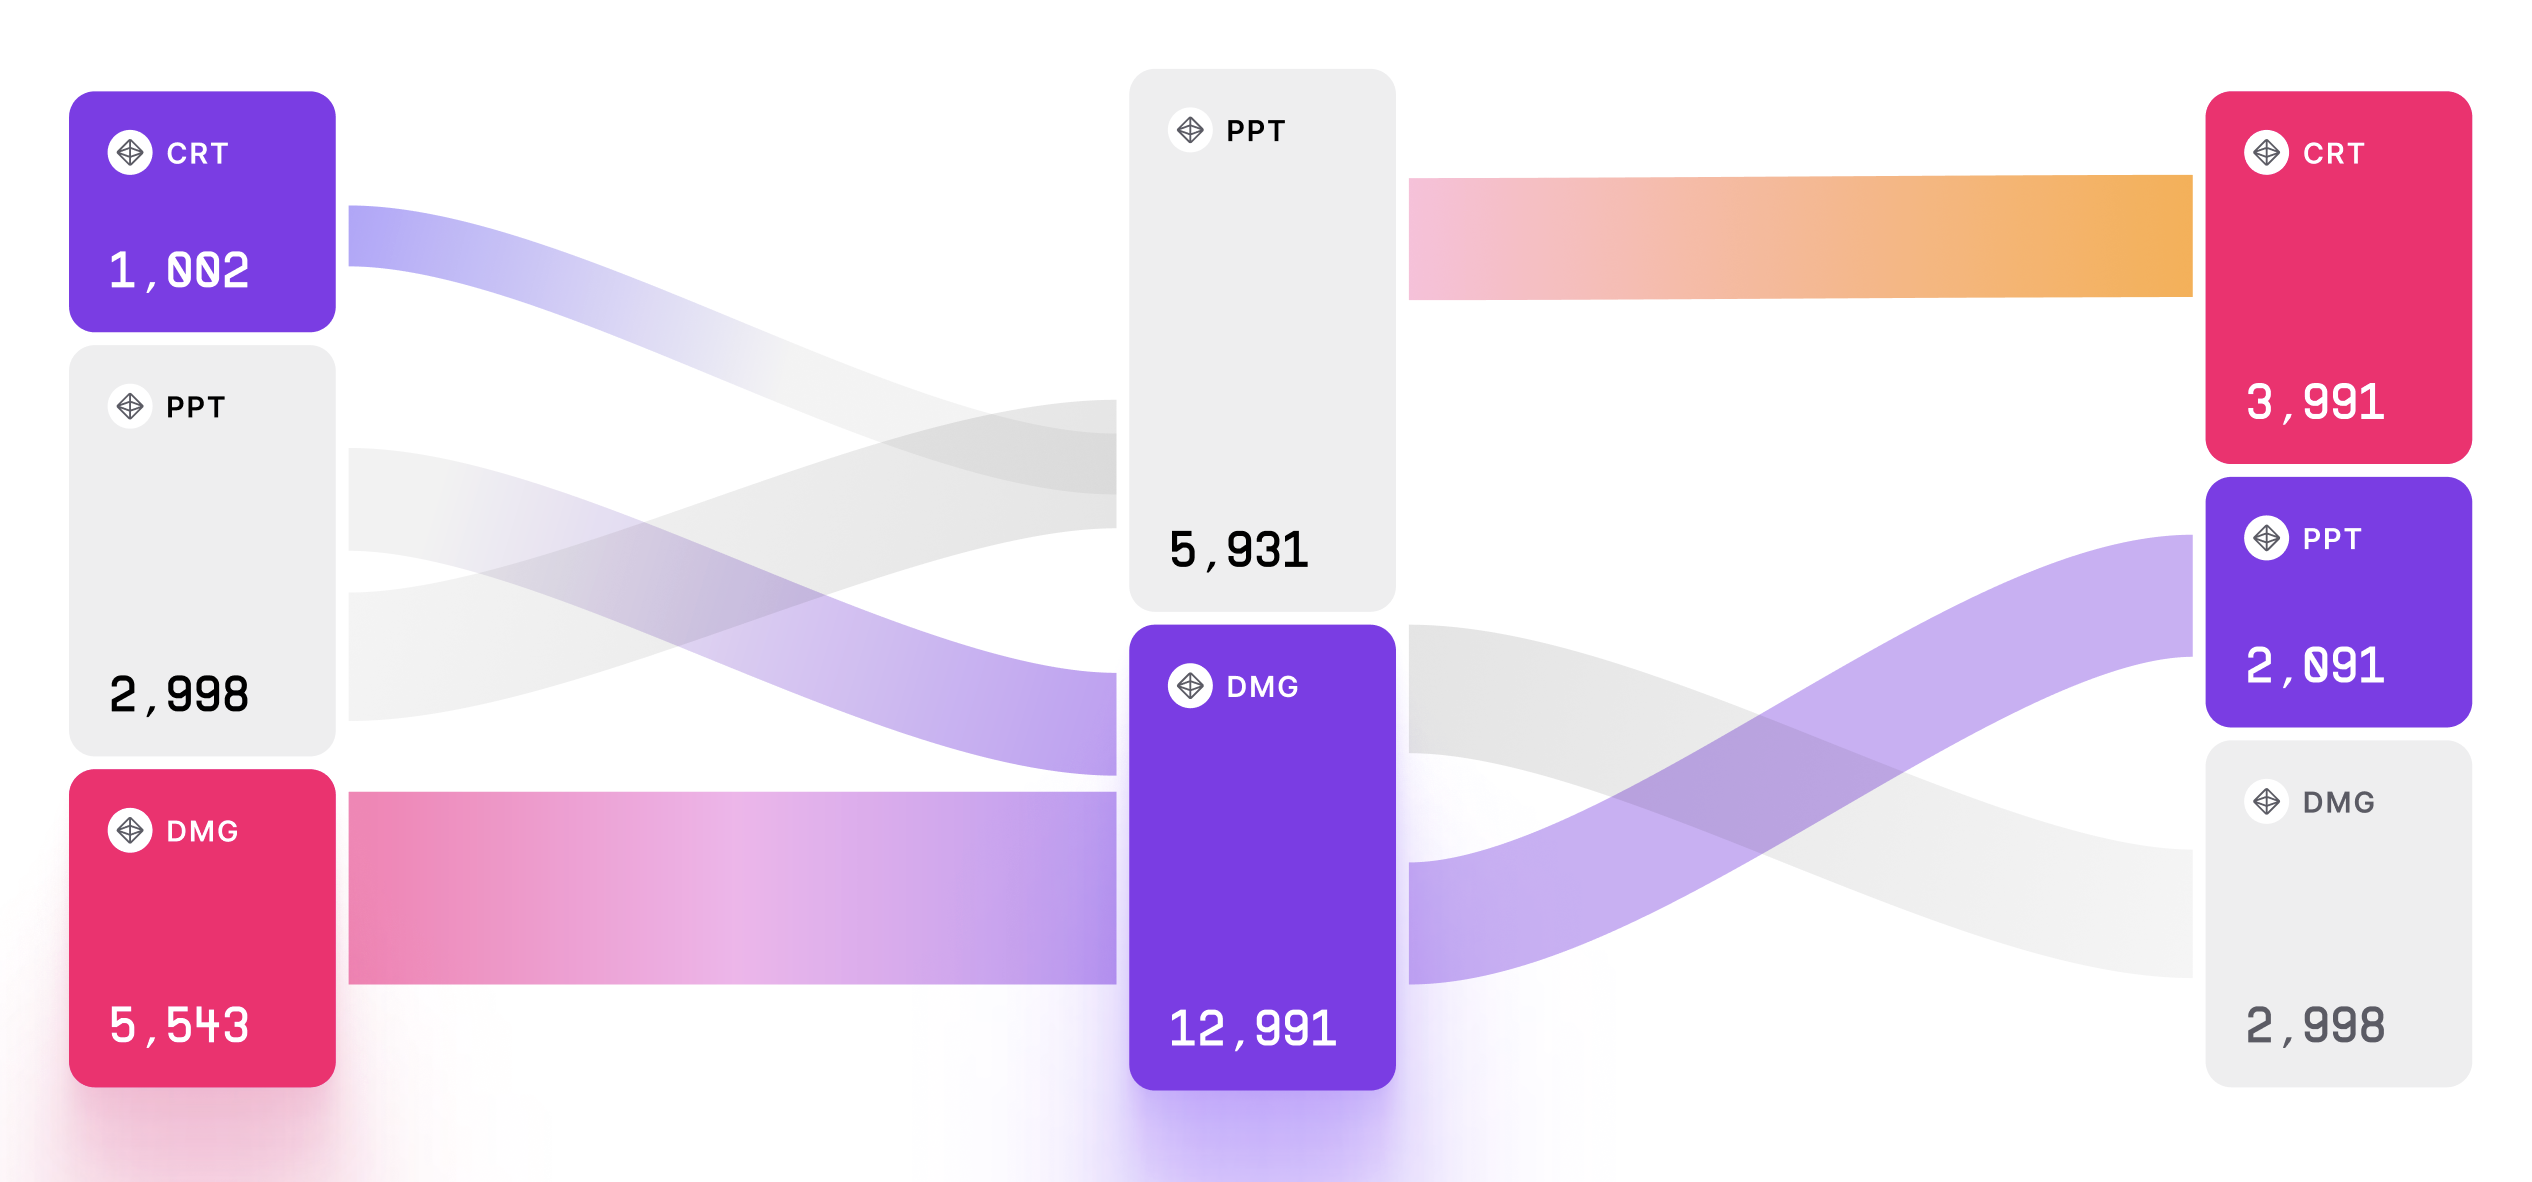
Sankey Chart is a data visualization chart that is used to show the flow of data or resources through a system. It is of...
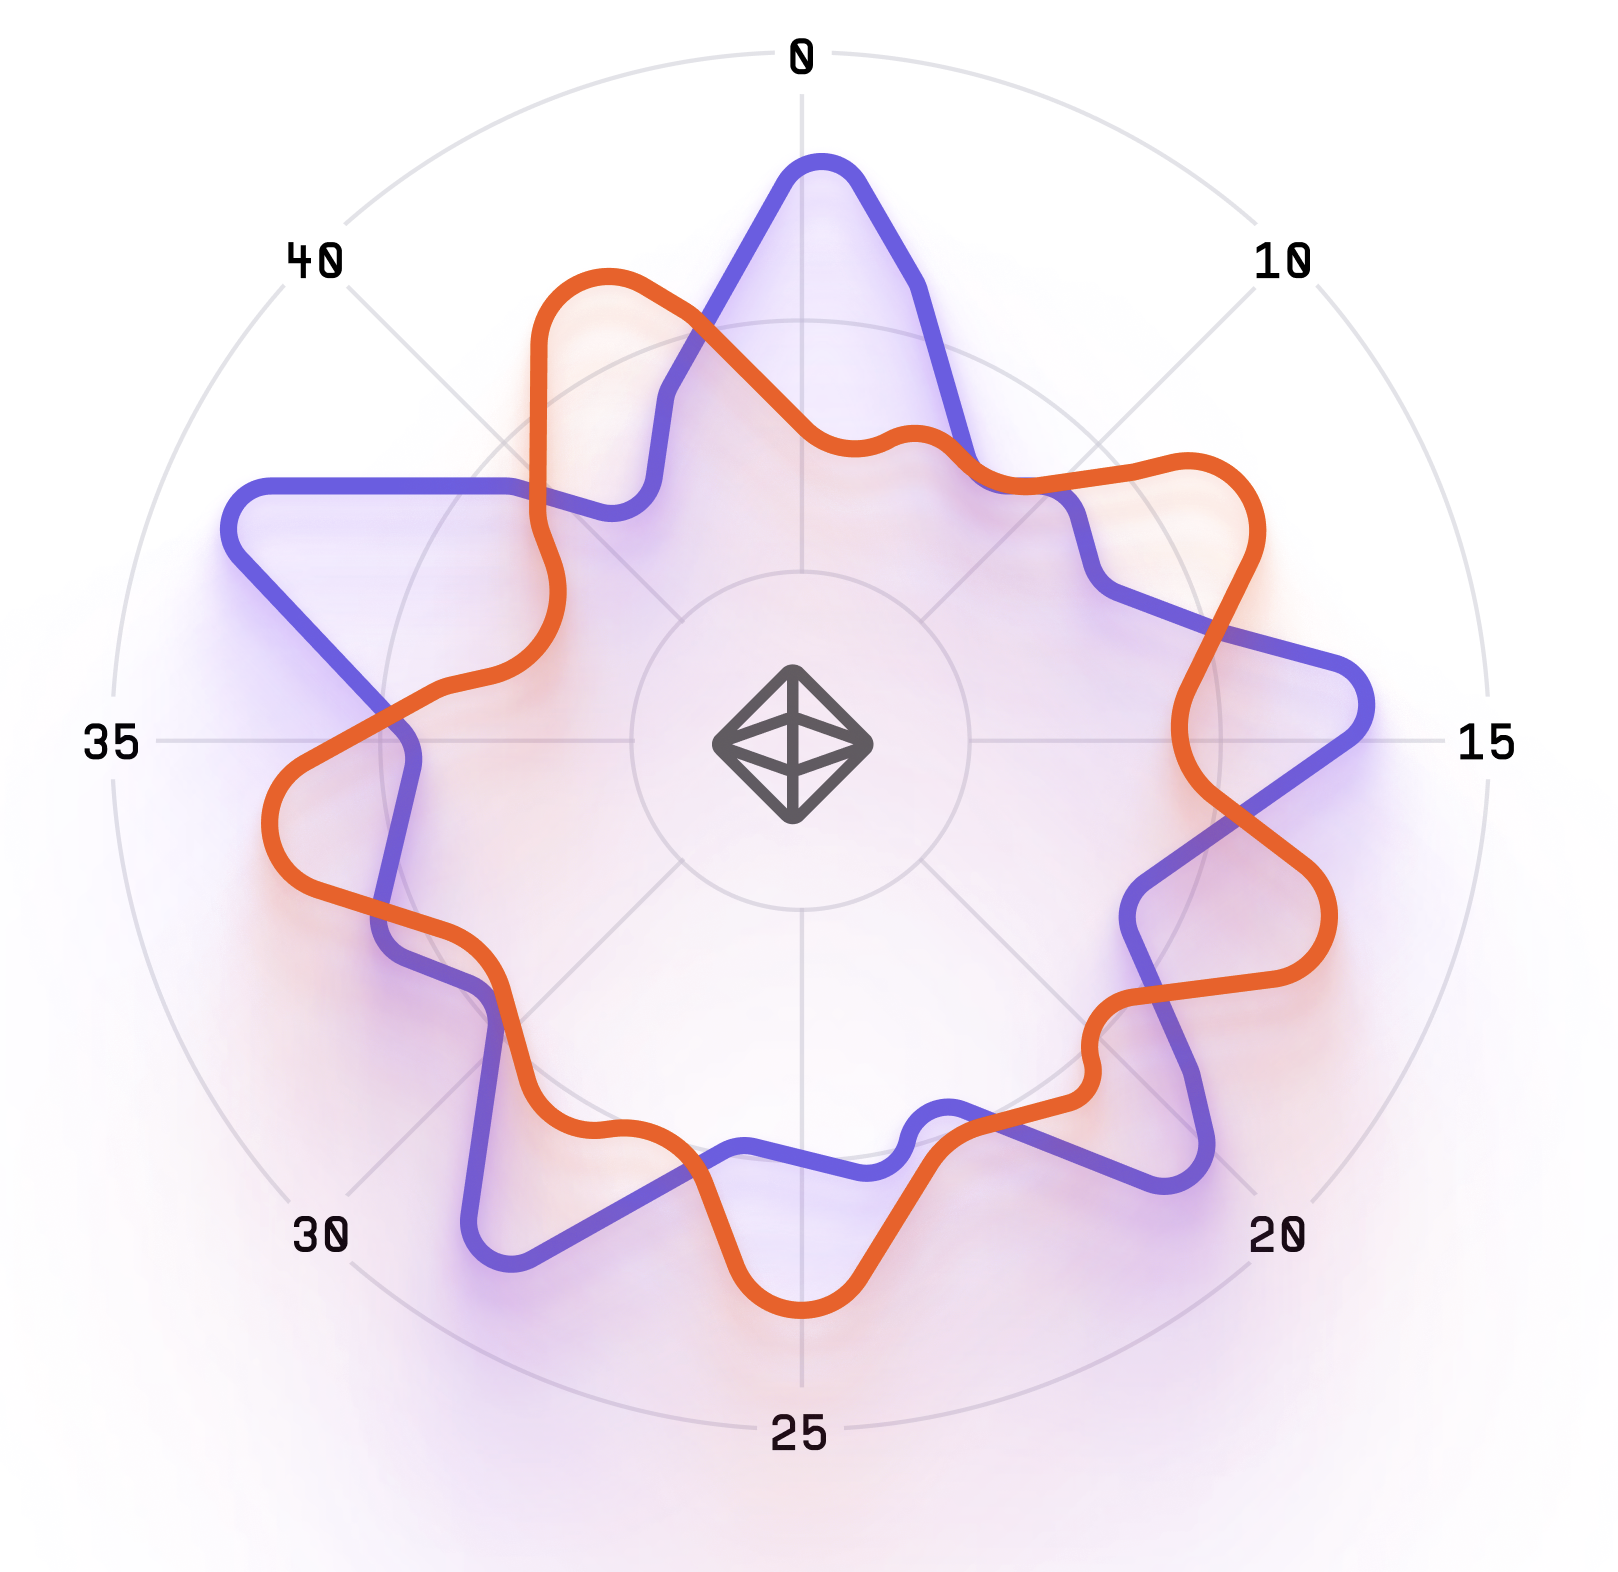
The Radar Chart, also known as a Spider Chart or Polar Chart, is a data visualization chart that is used to display mult...

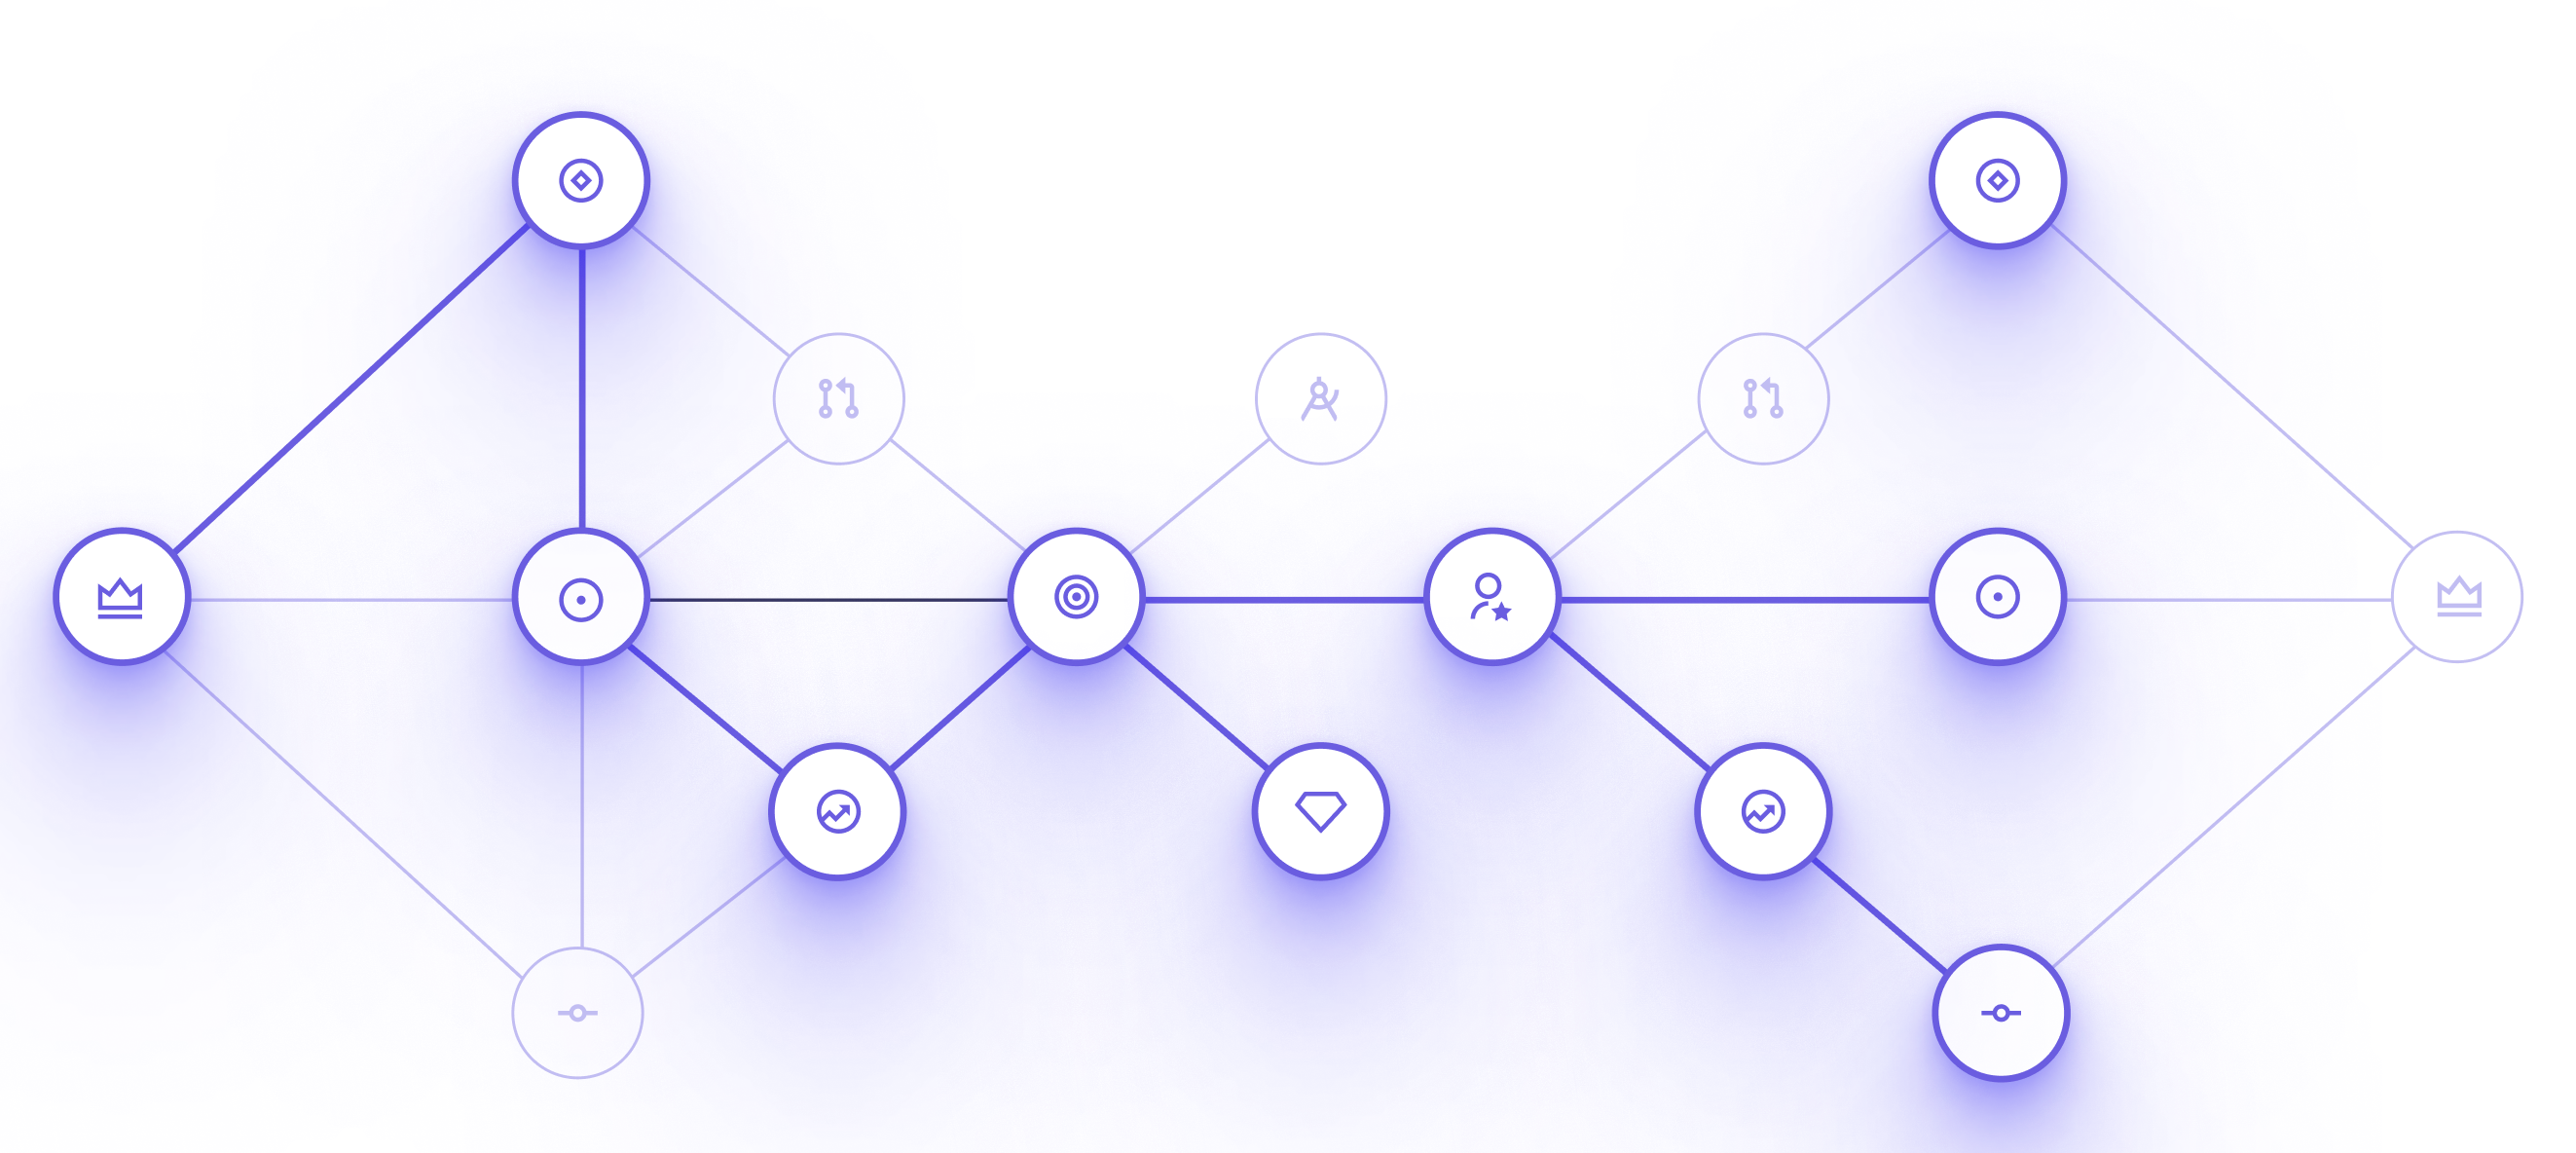
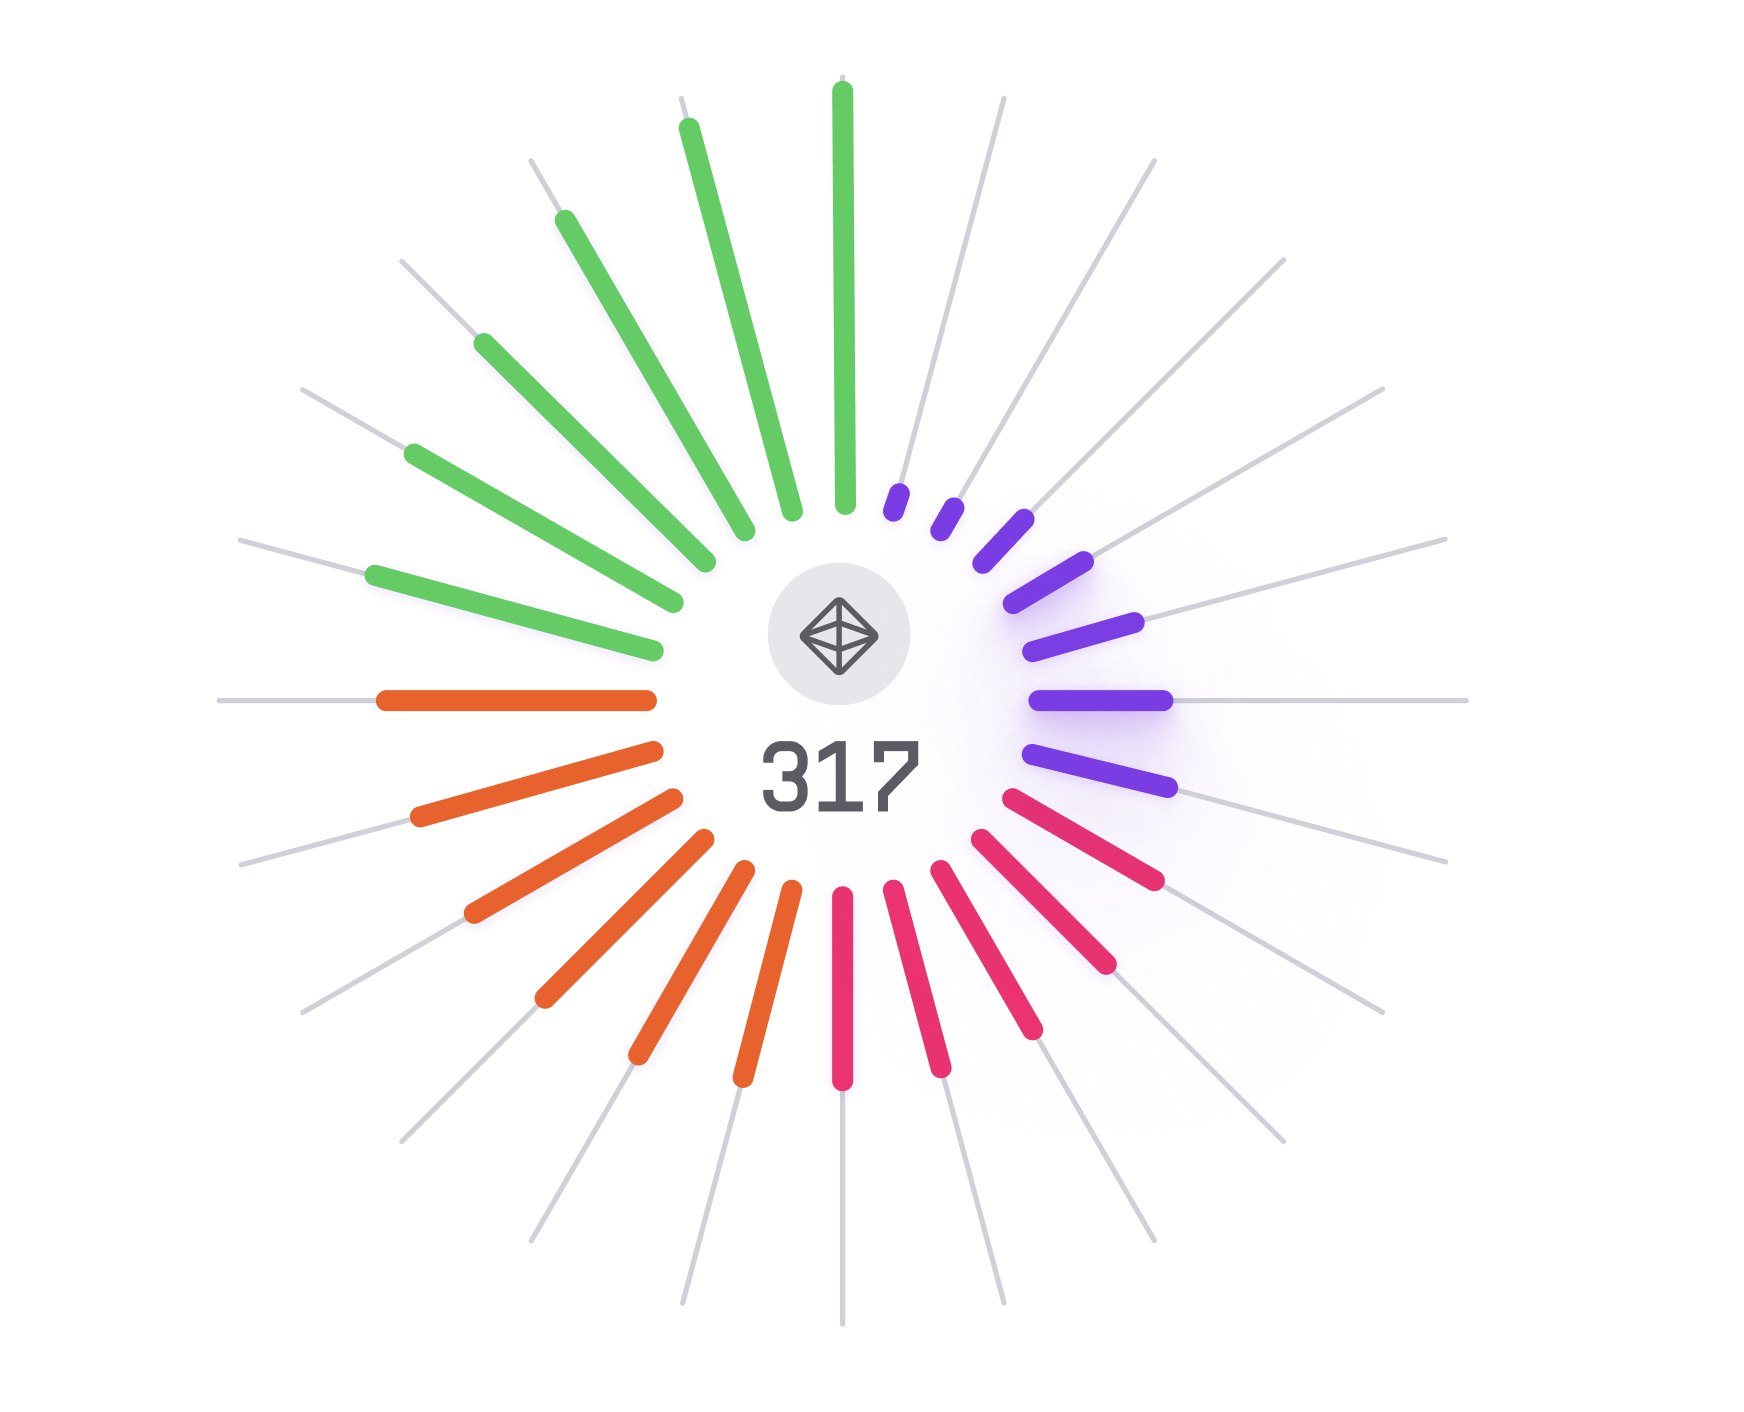
Radial convergence chart is a type of data visualization tool that represents the convergence, divergence, or similarity...
Radial histogram, also known as a circular histogram, is a type of chart used to display the distribution of data in a c...
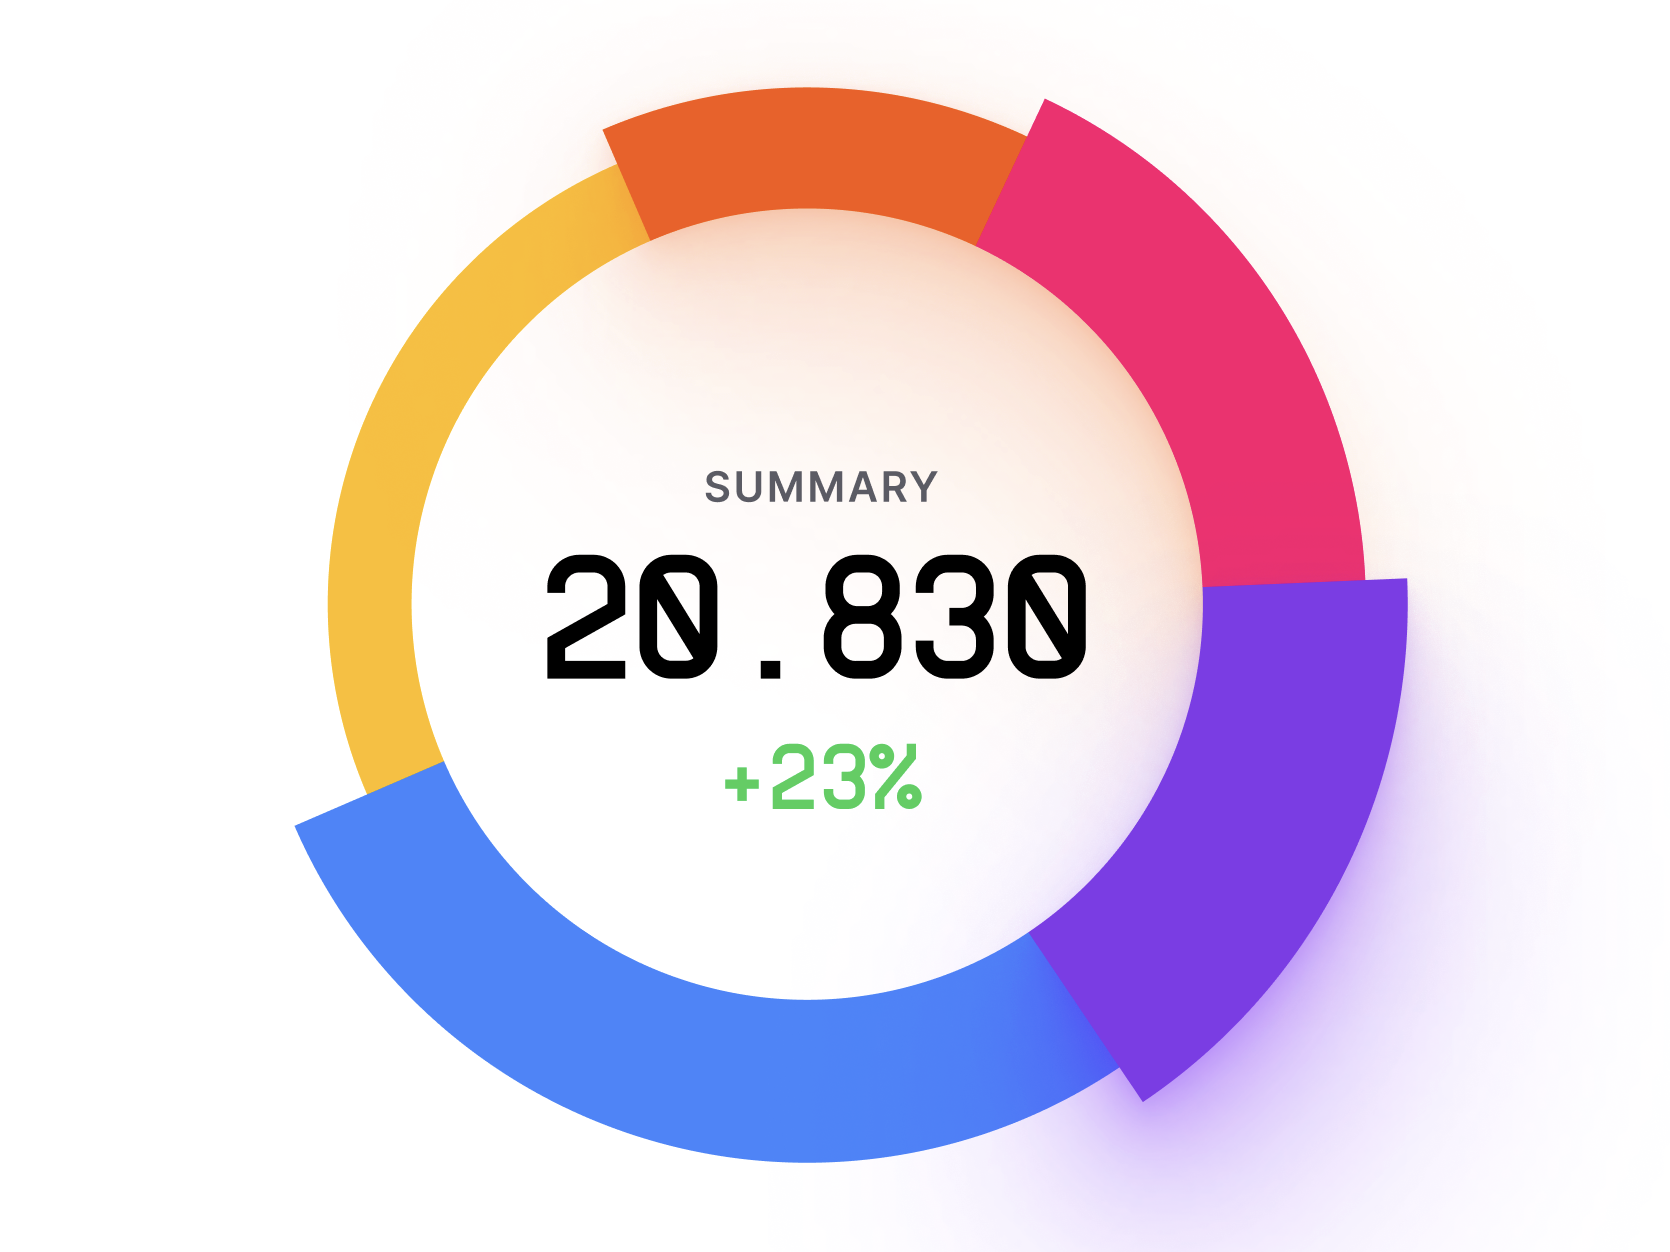
Pie chart is a type of chart used to display data as a circle divided into slices. Each slice represents a portion of th...
The Parallel Coordinates plot is a data visualization technique used to visualize and analyze high-dimensional datasets....
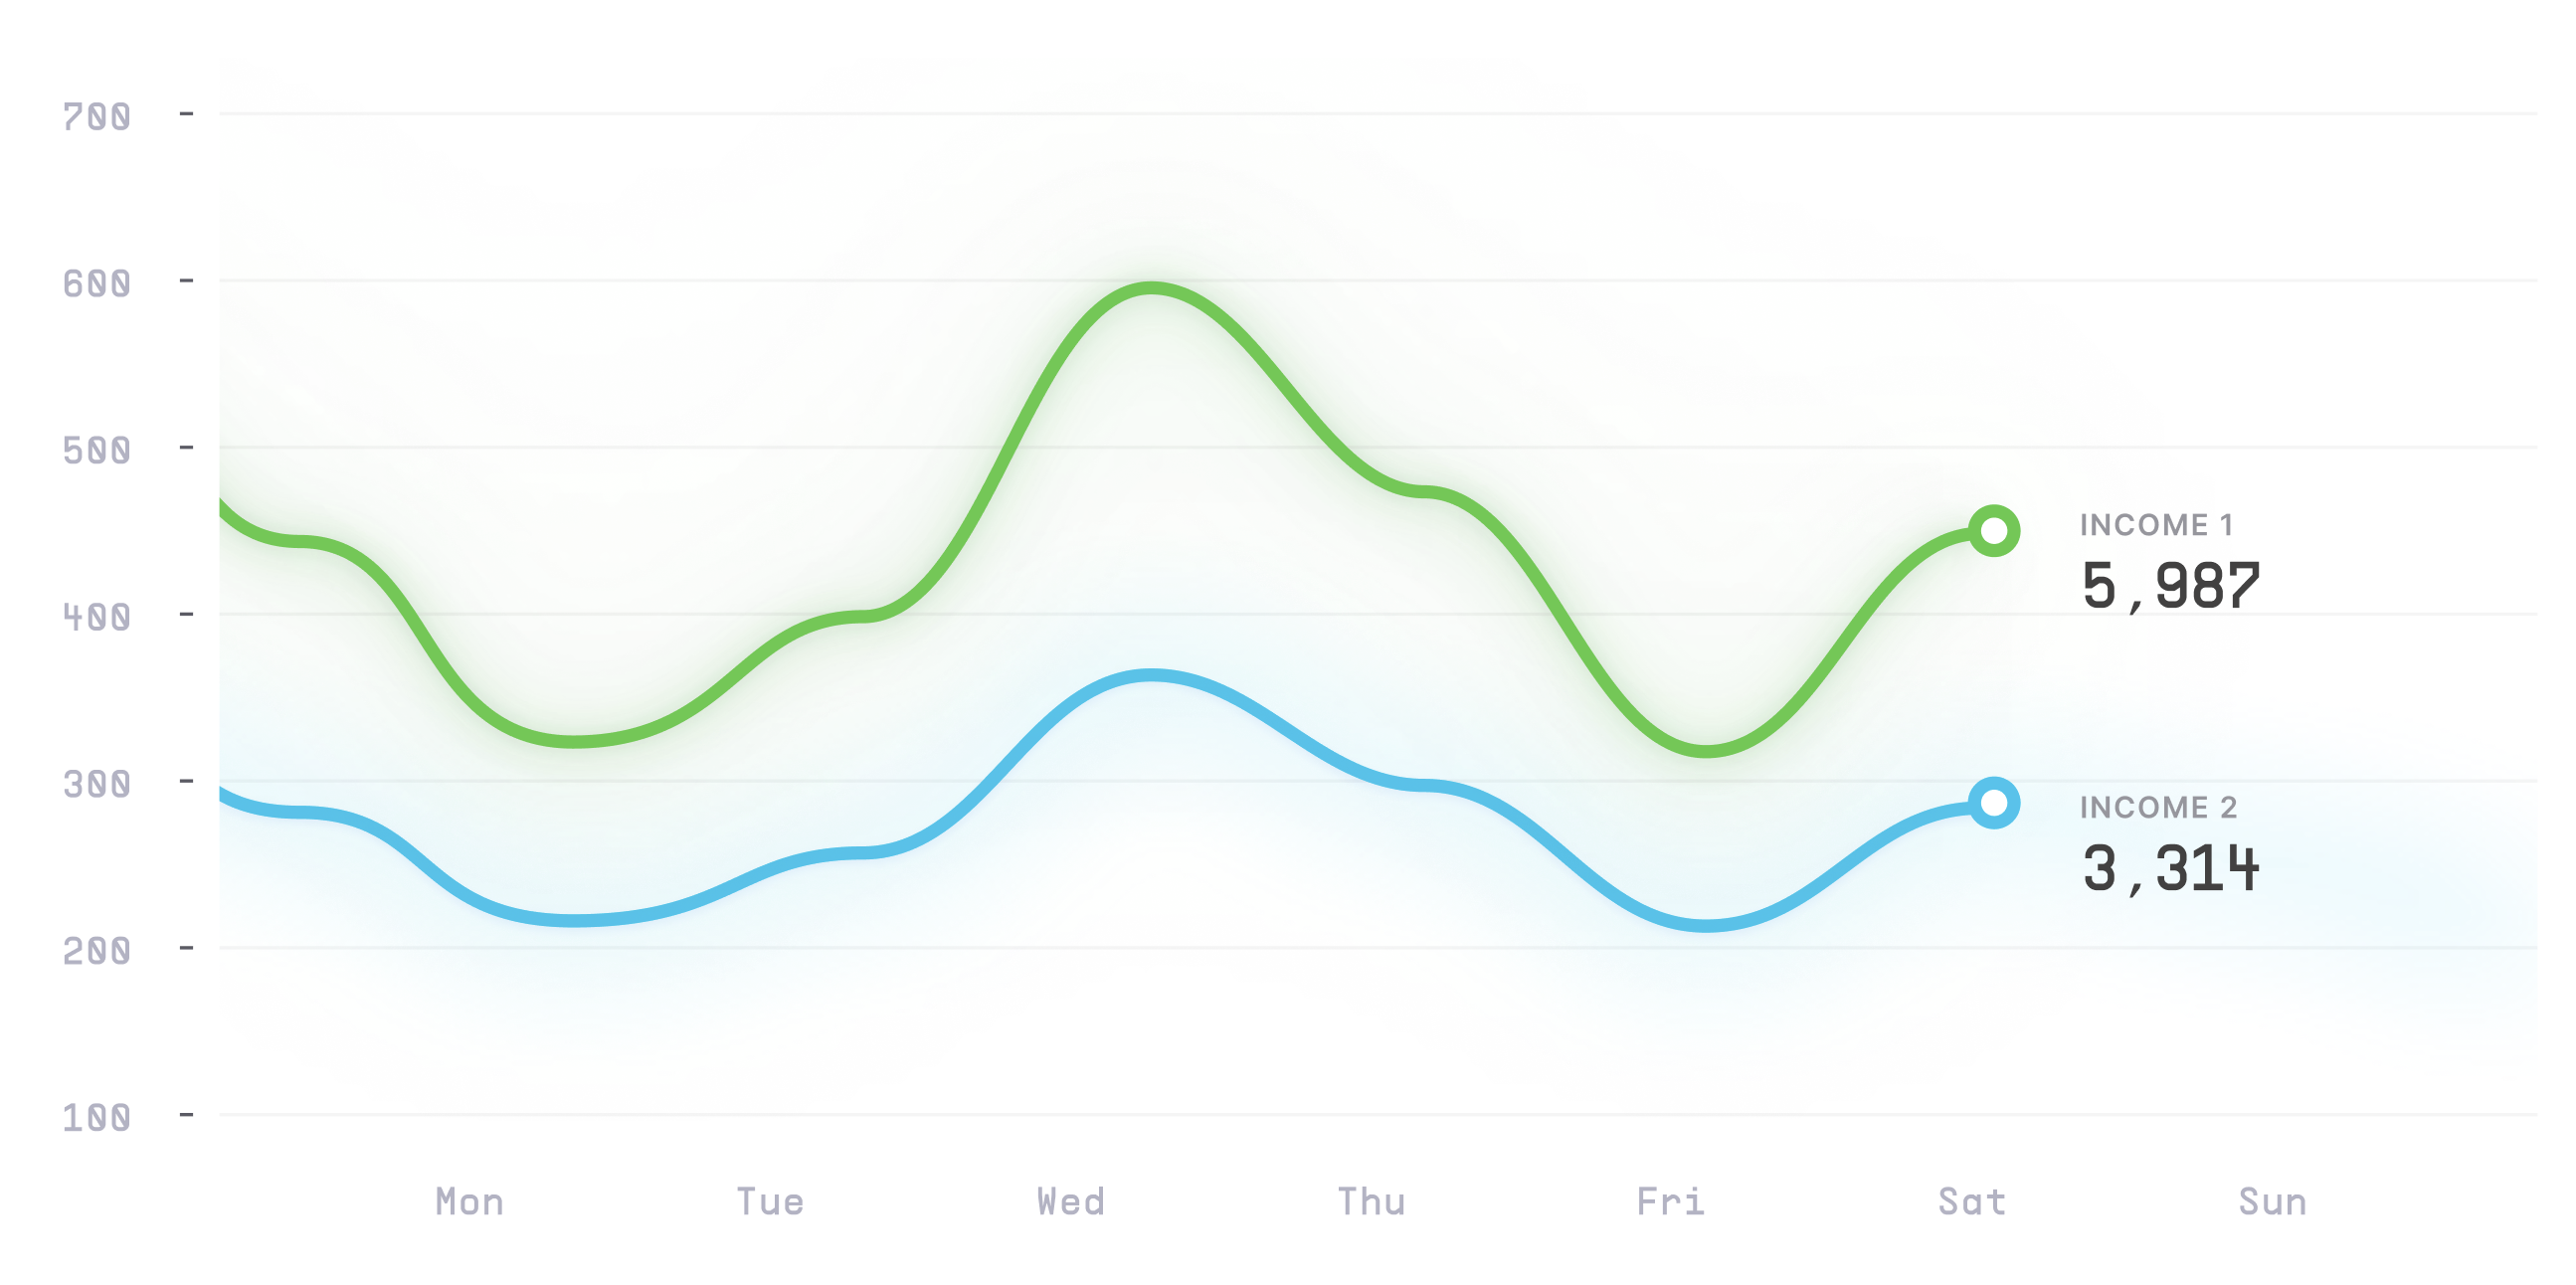
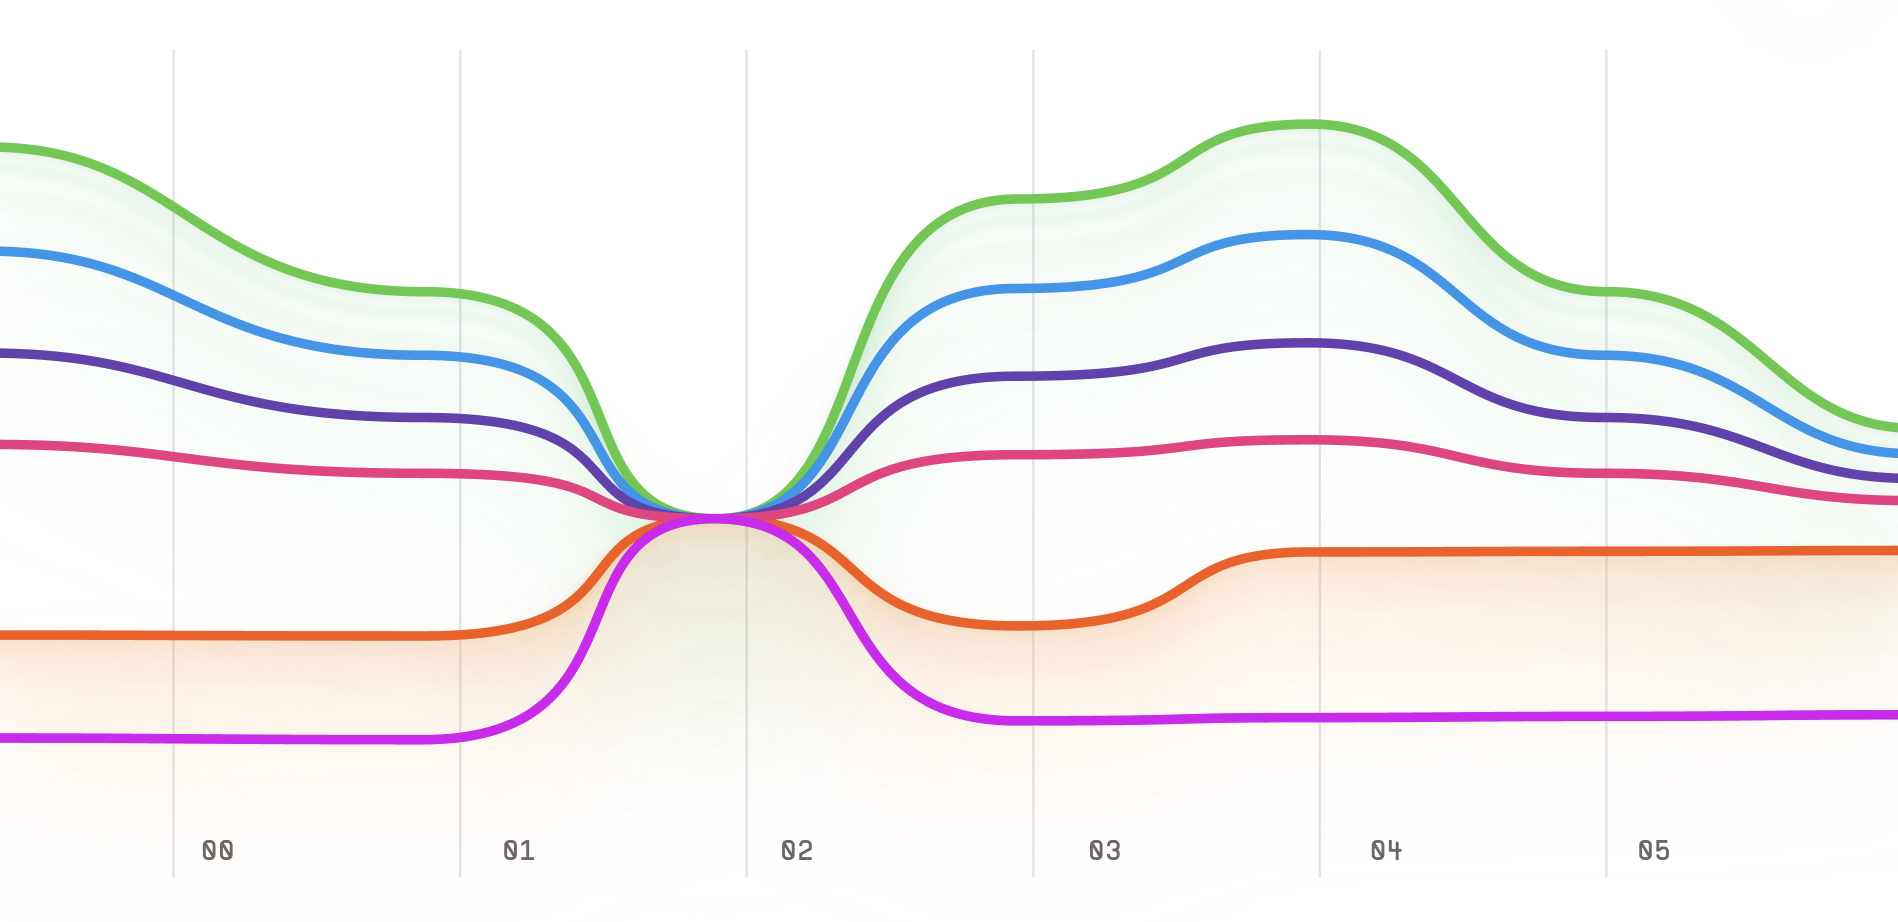
Line chart, also known as a line graph, is a type of chart used to display data as a series of points connected by strai...
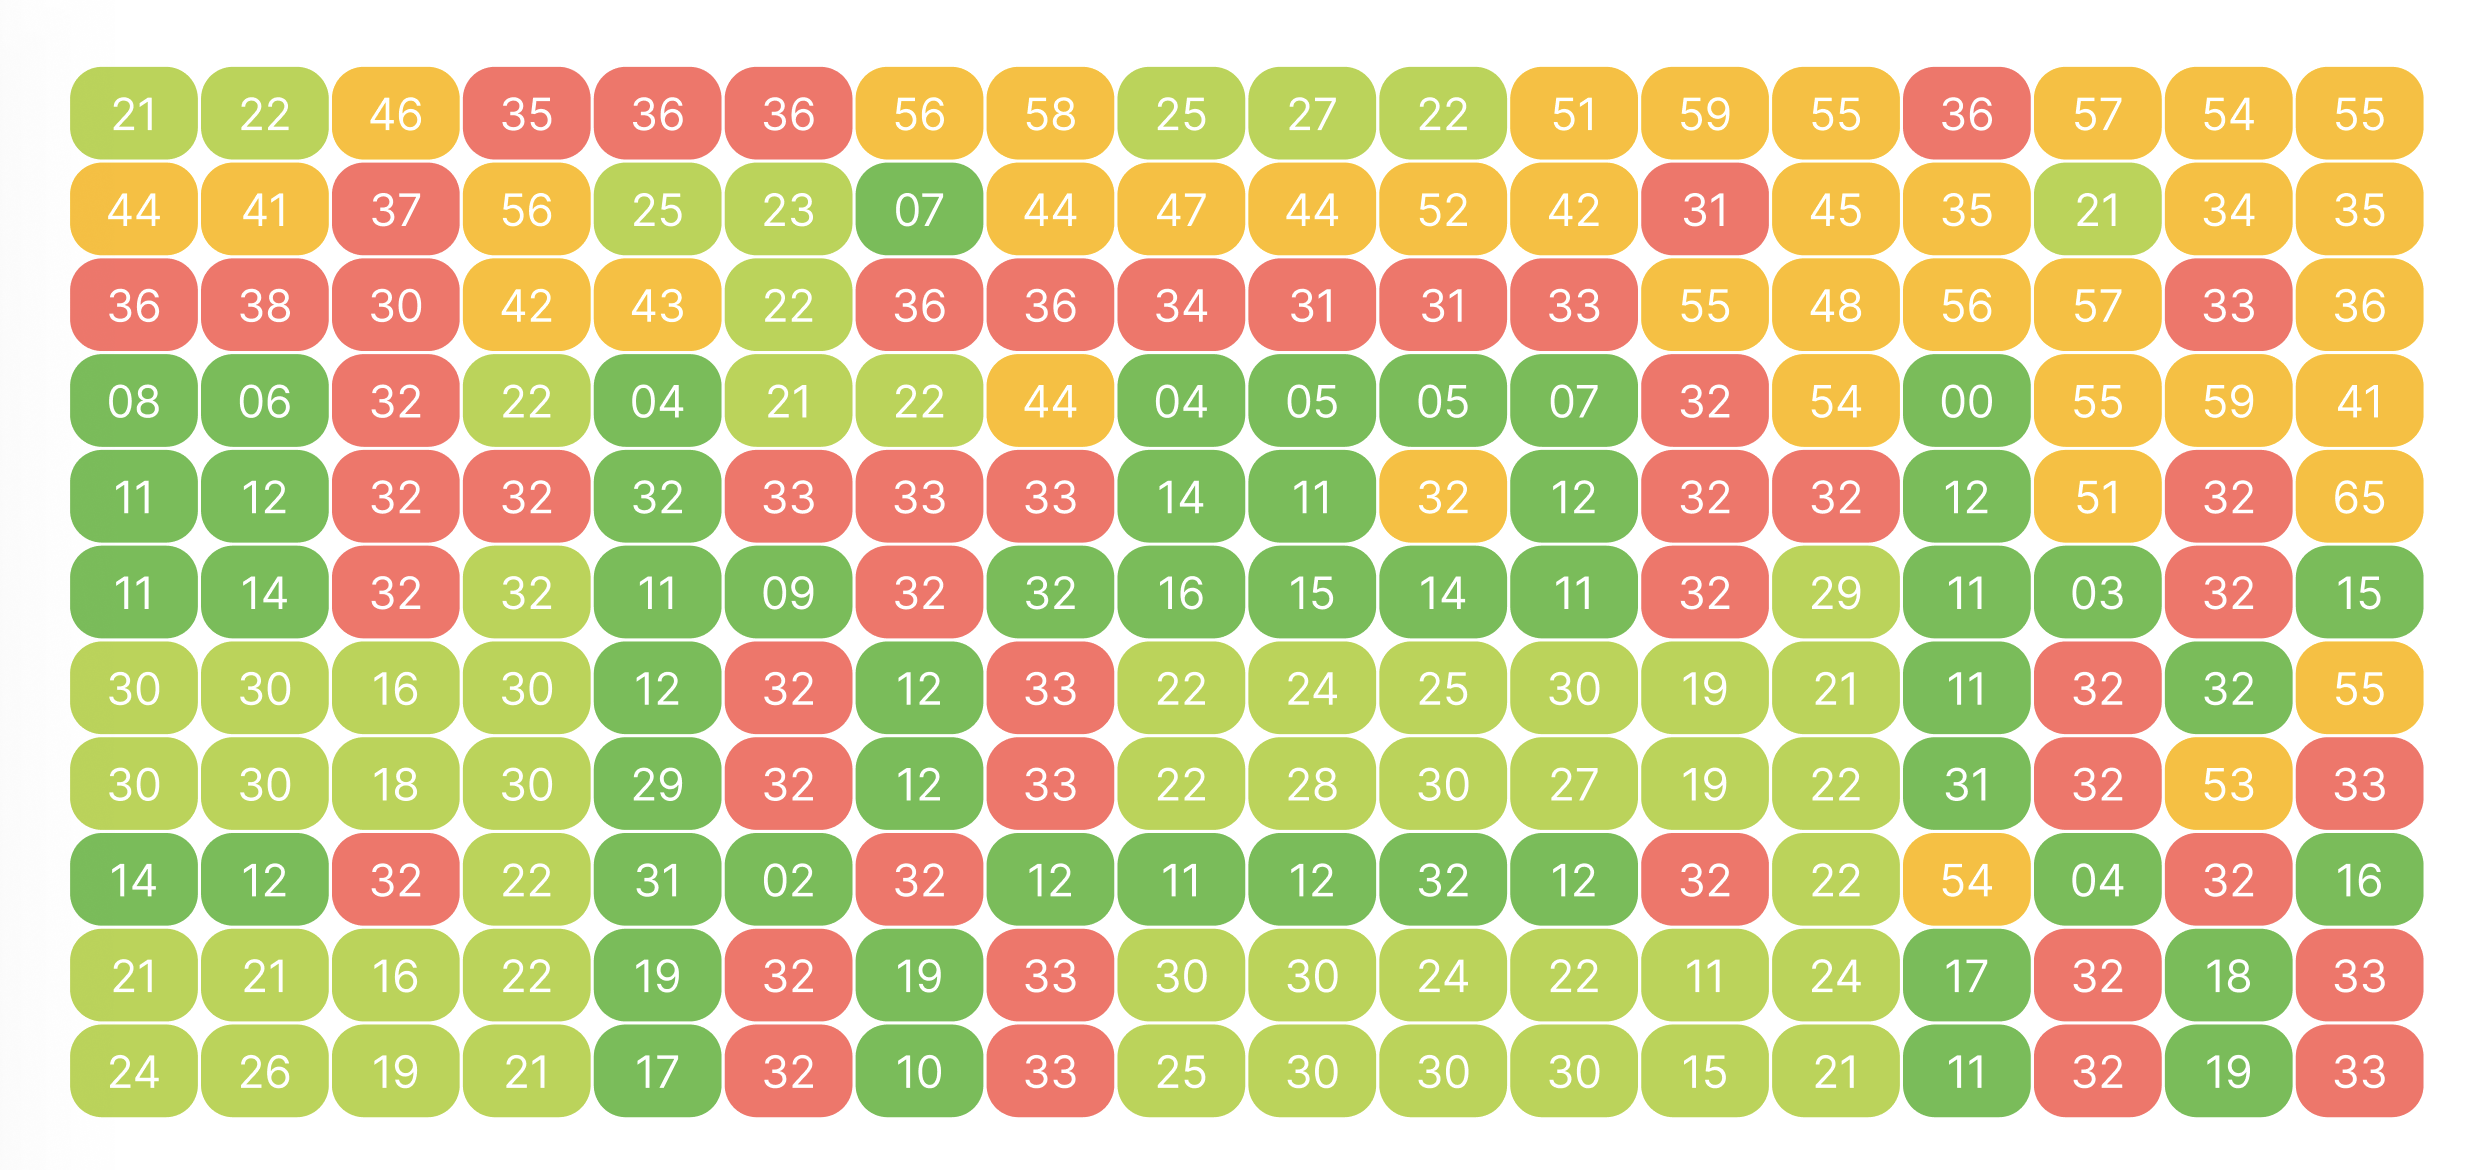
Heat Map, also known as a Heat Table, Density Table, or Heat Chart, is a data visualization chart that uses color to rep...
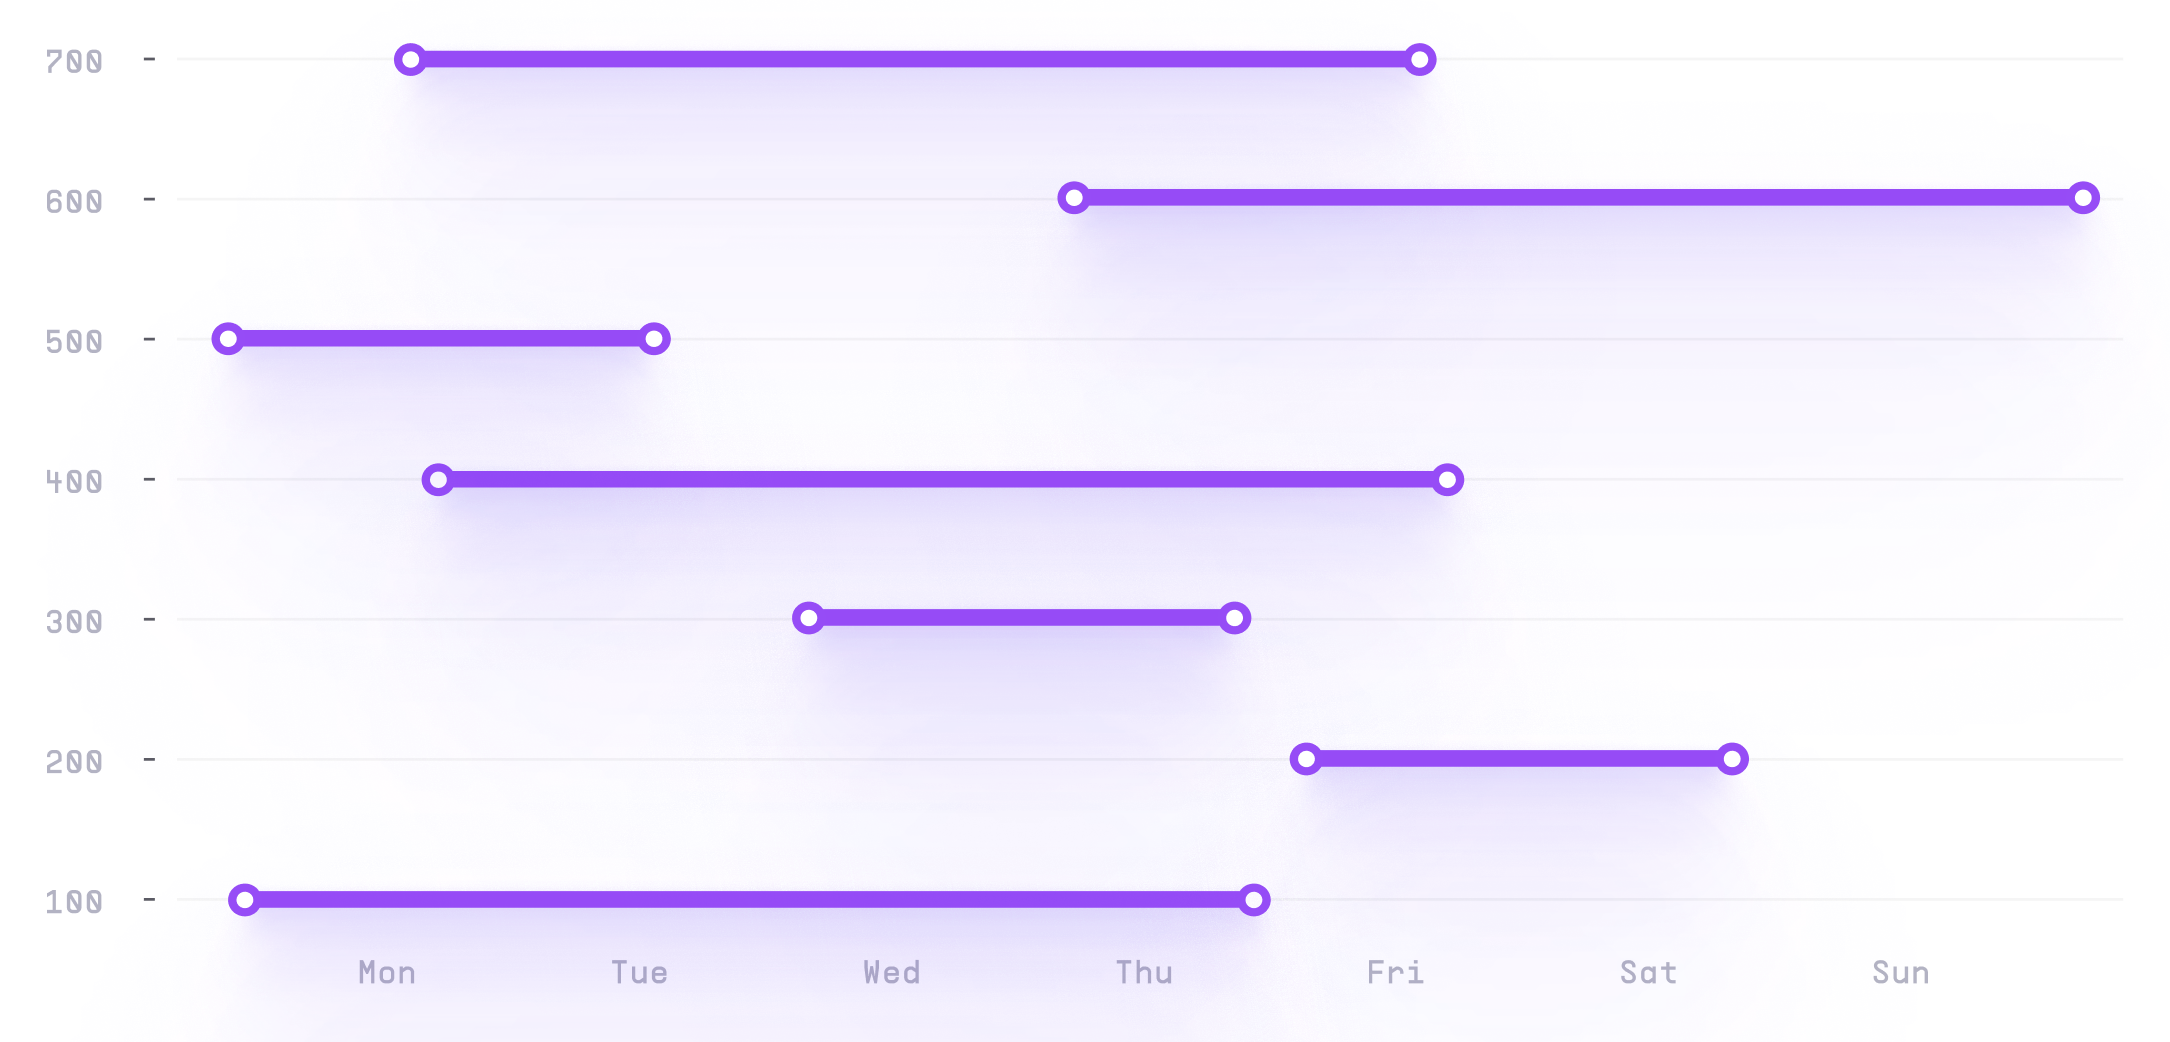
The Dumbbell Plot is a data visualization chart that is used to compare two sets of data with a common variable. It is a...
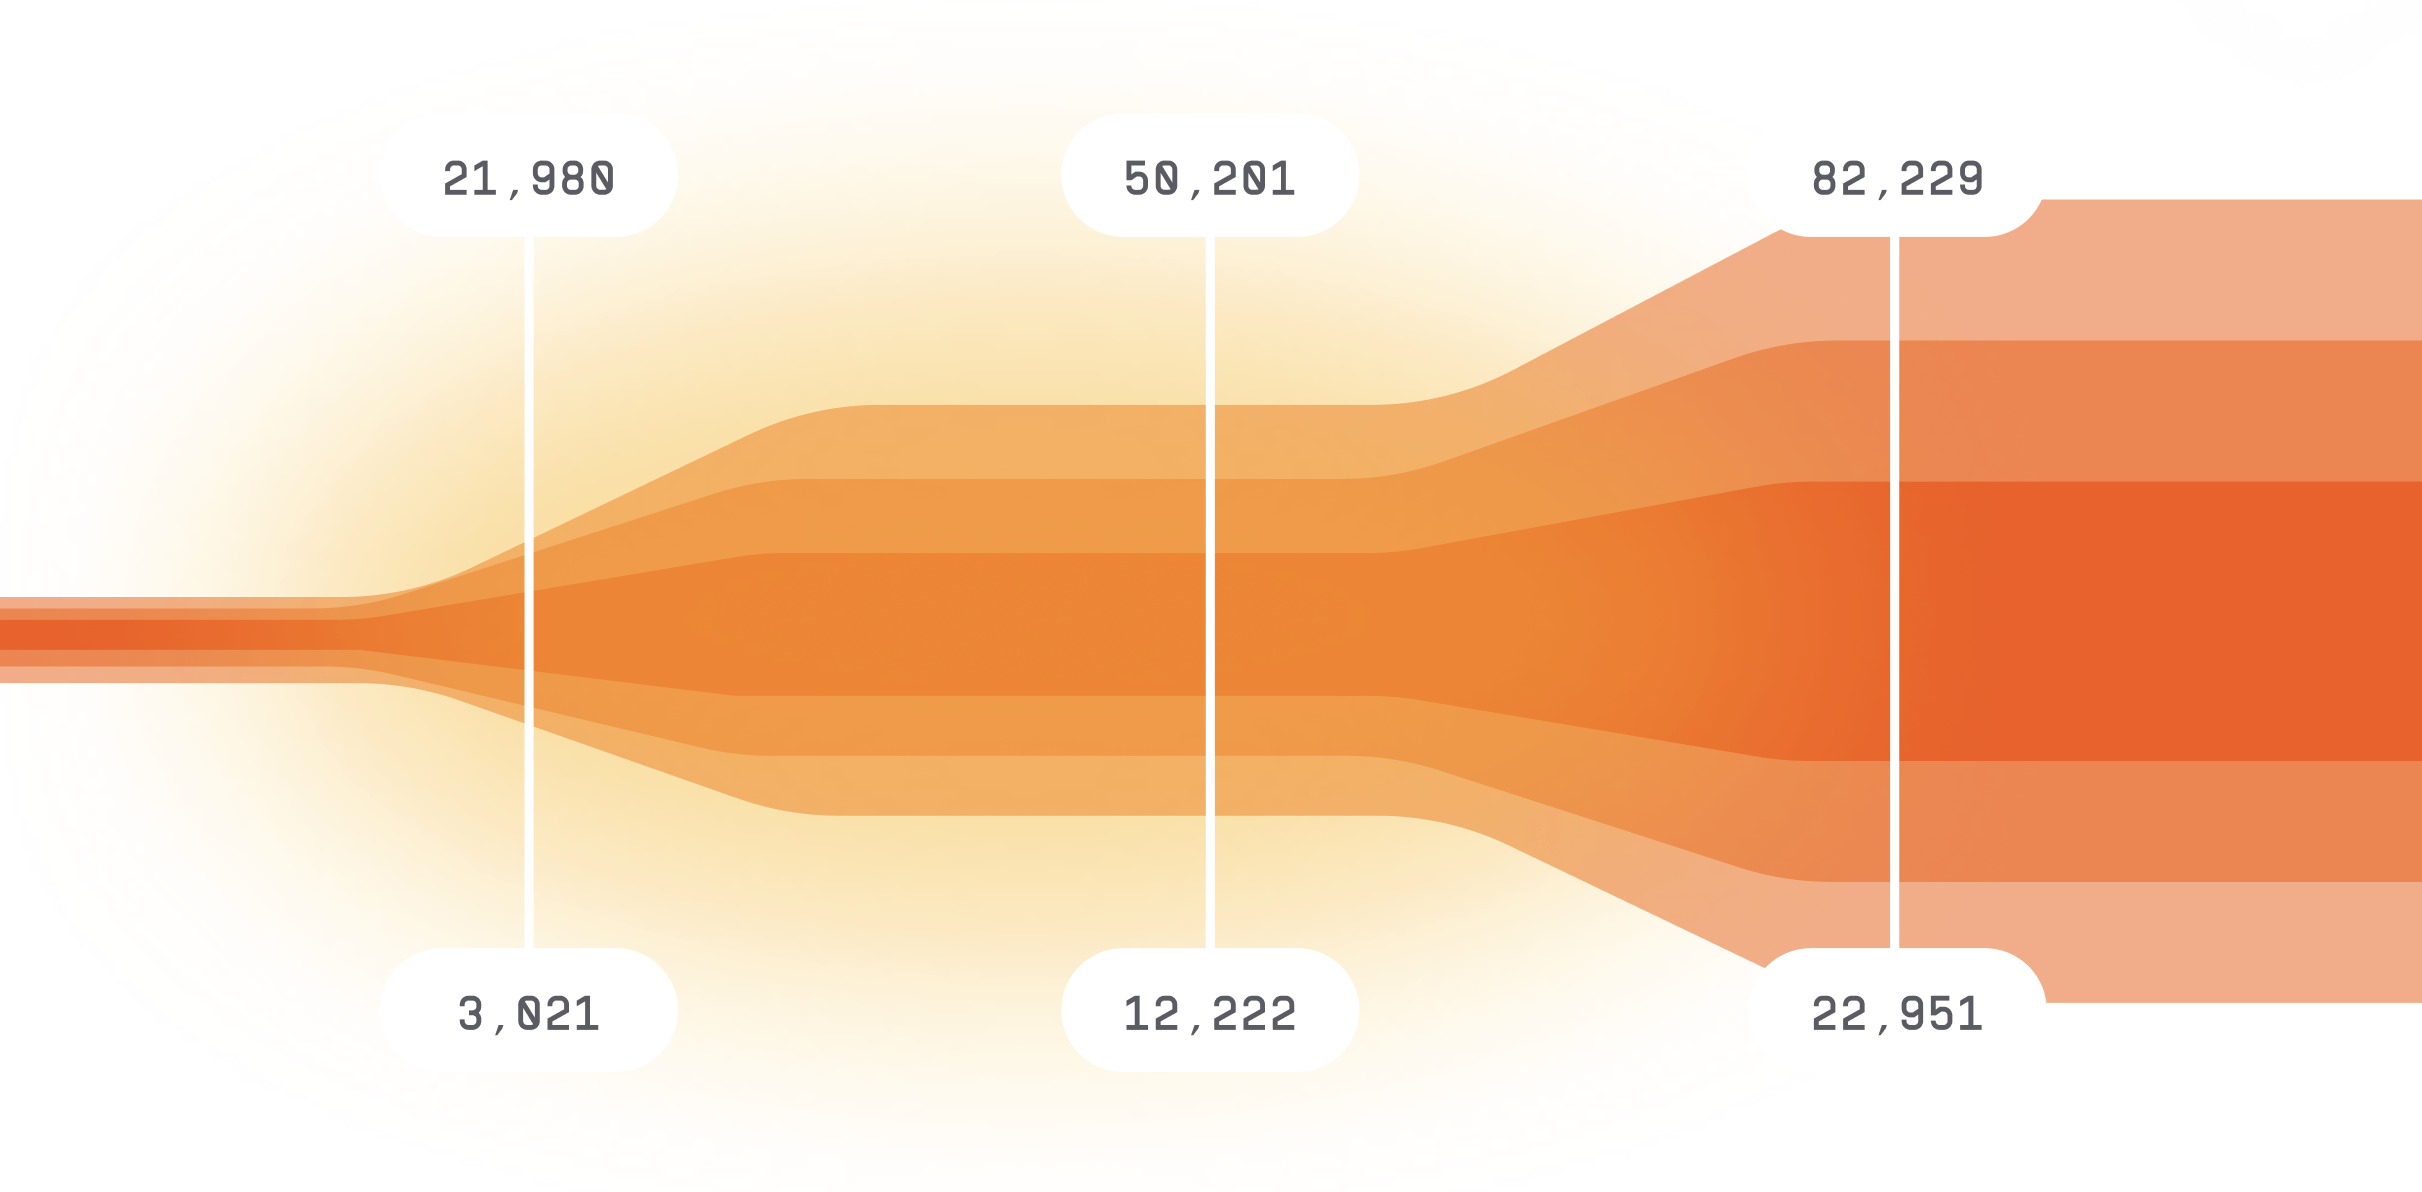
Funnel Chart is a data visualization chart that is used to show the stages of a process or sales pipeline. It is often u...
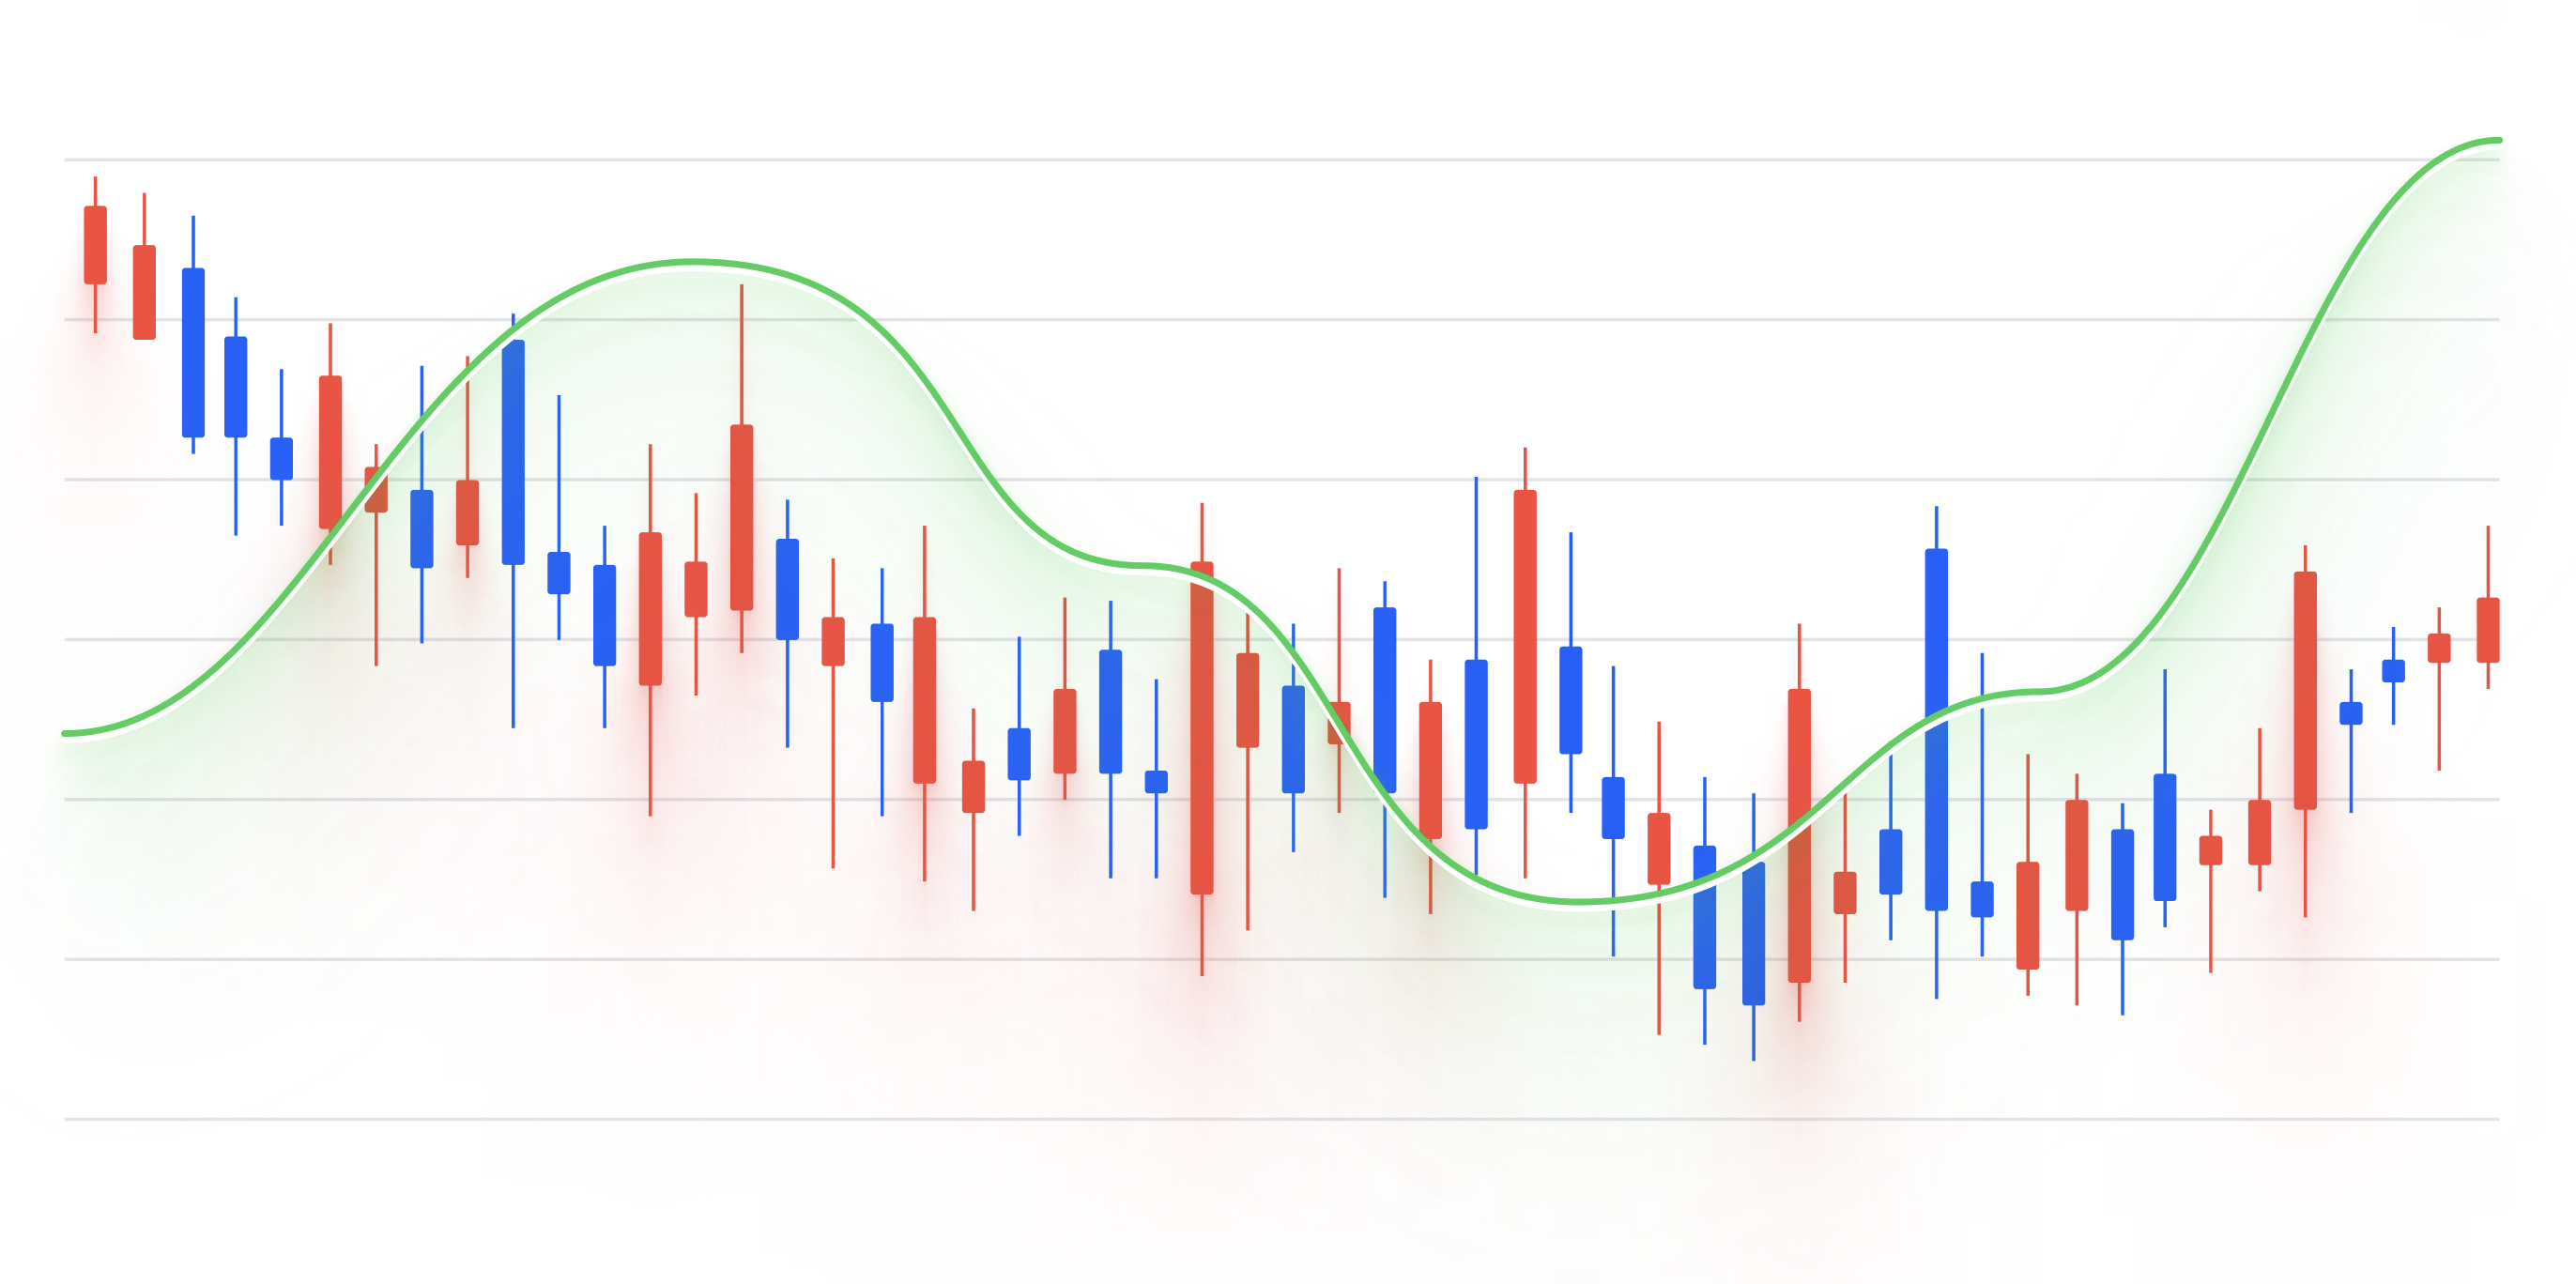
Candlestick chart is a type of financial chart used to display the price movement of an asset over time. It is commonly ...
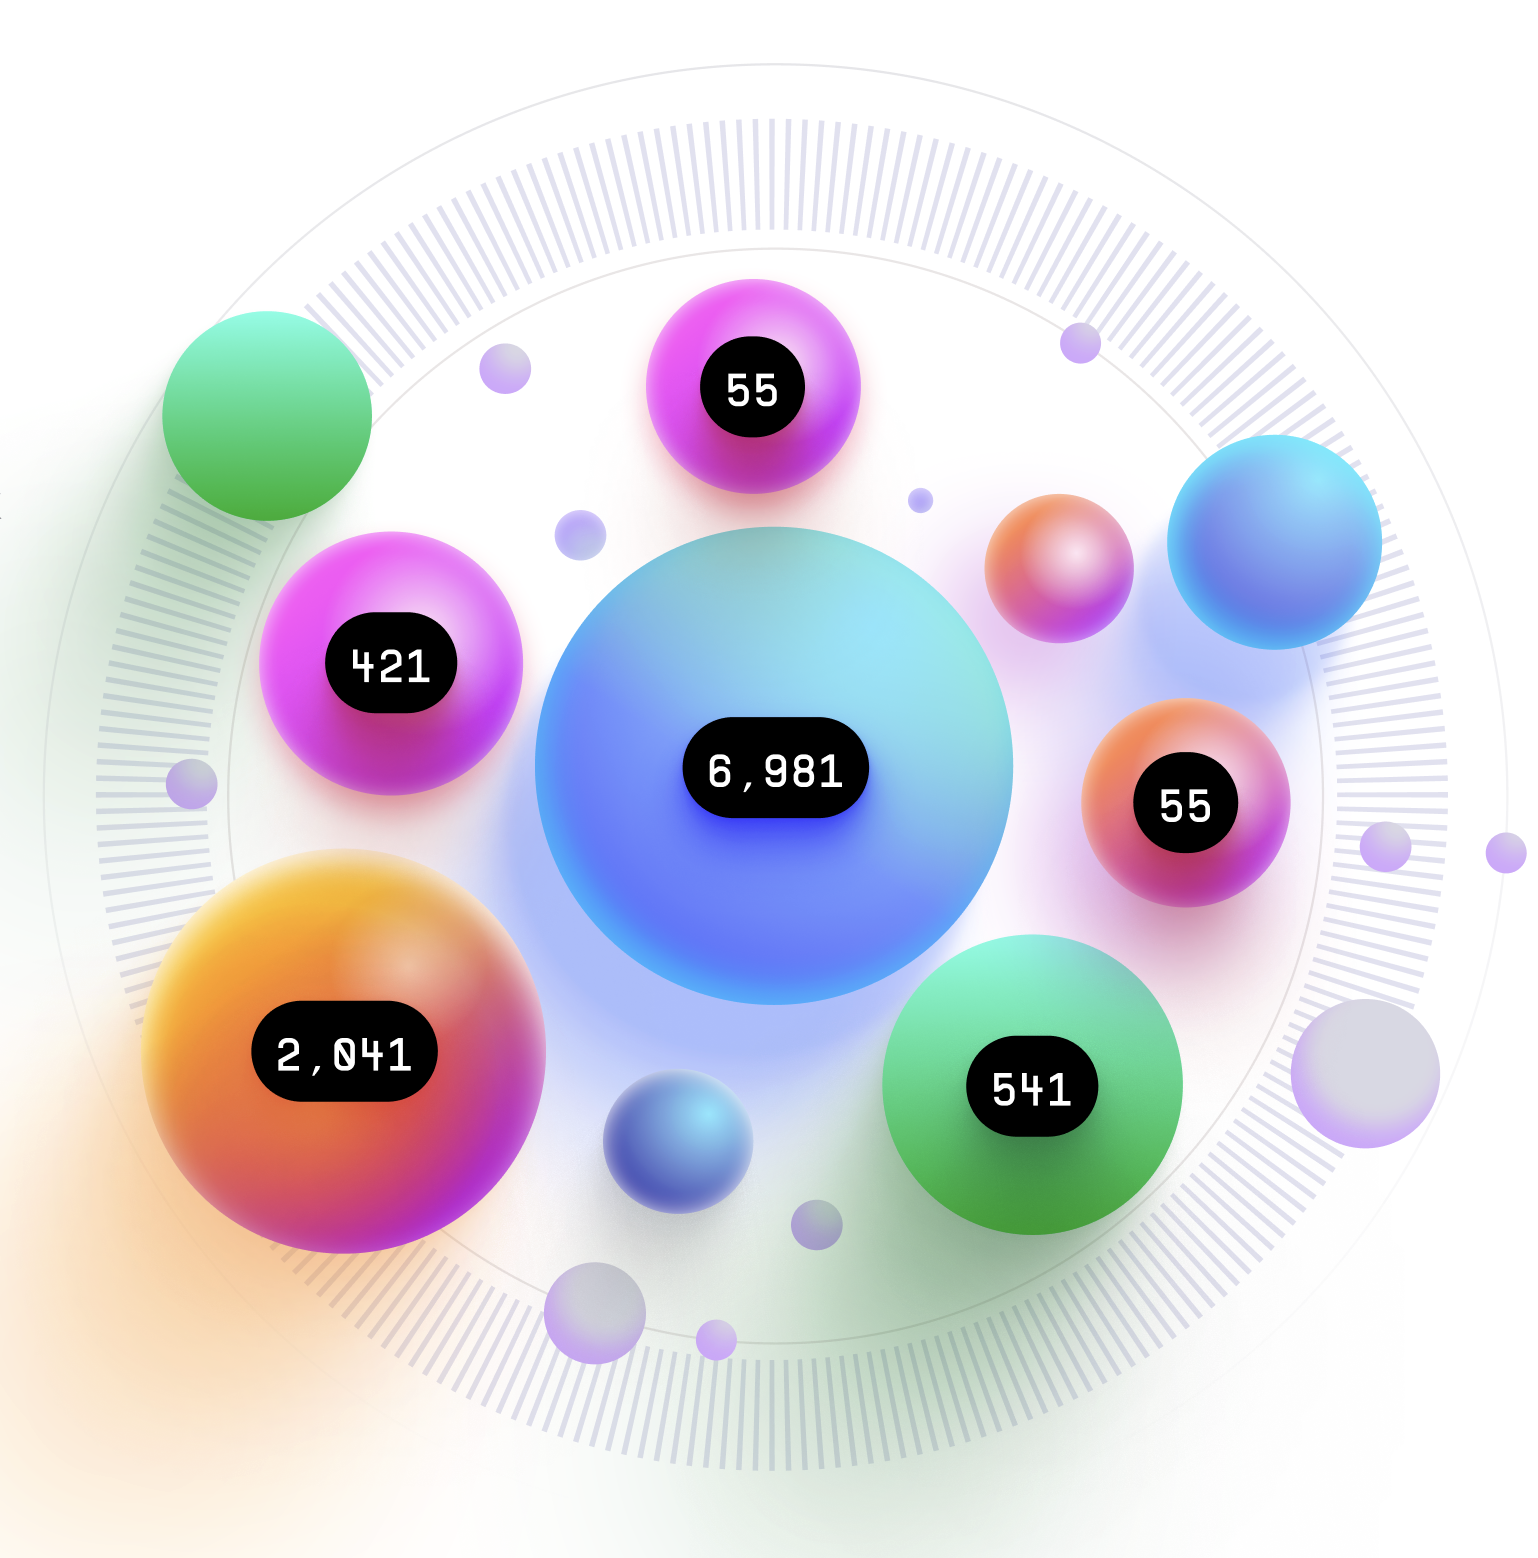
The Bubble Chart is a data visualization chart that is used to display three dimensions of data simultaneously. It is of...