Radial Histogram
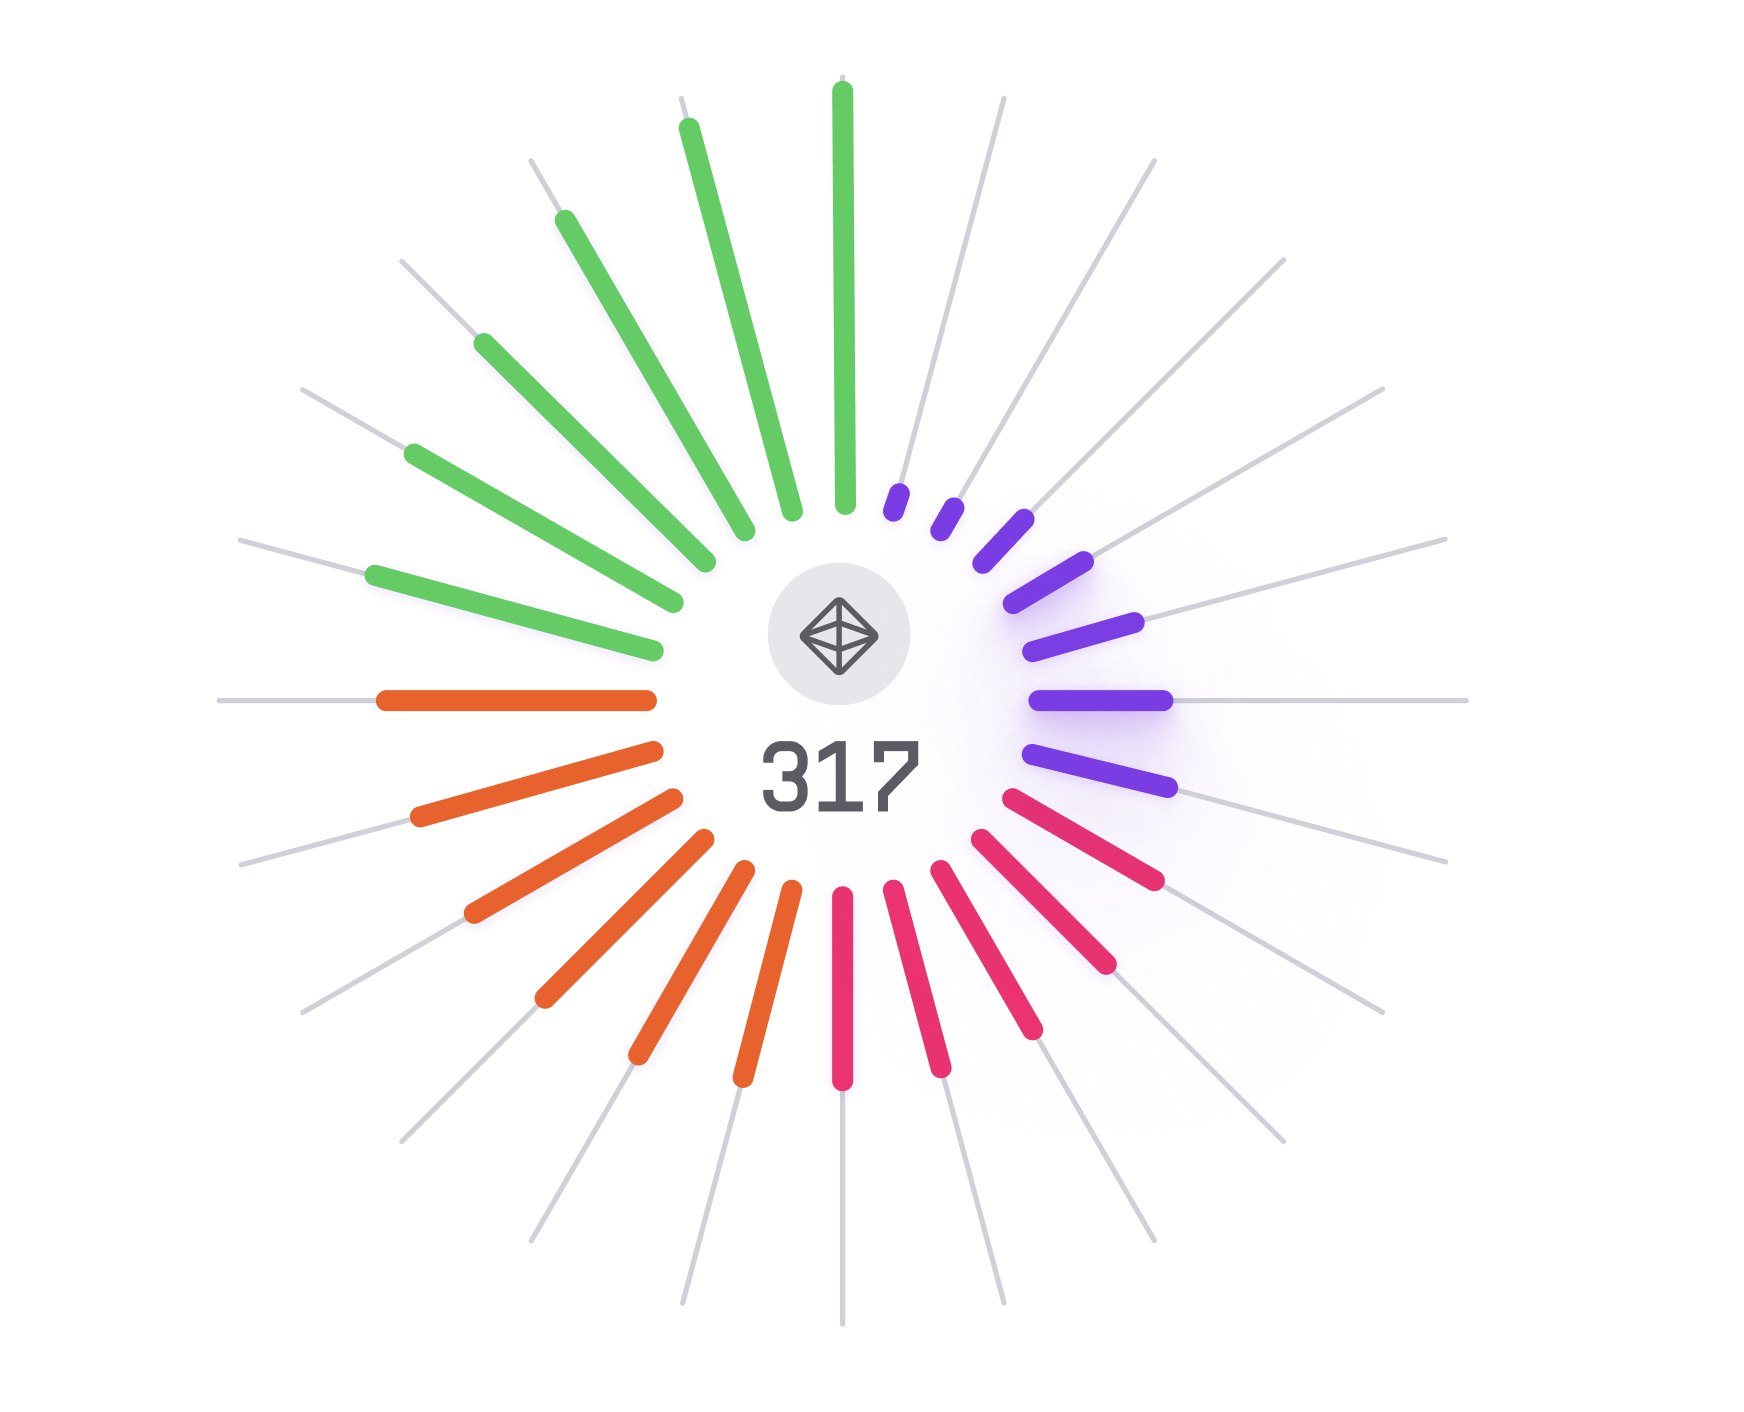
Radial histogram, also known as a circular histogram, is a type of chart used to display the distribution of data in a circular fashion. It is similar to a traditional histogram, but the bars are arranged in a circular pattern.
Plotting
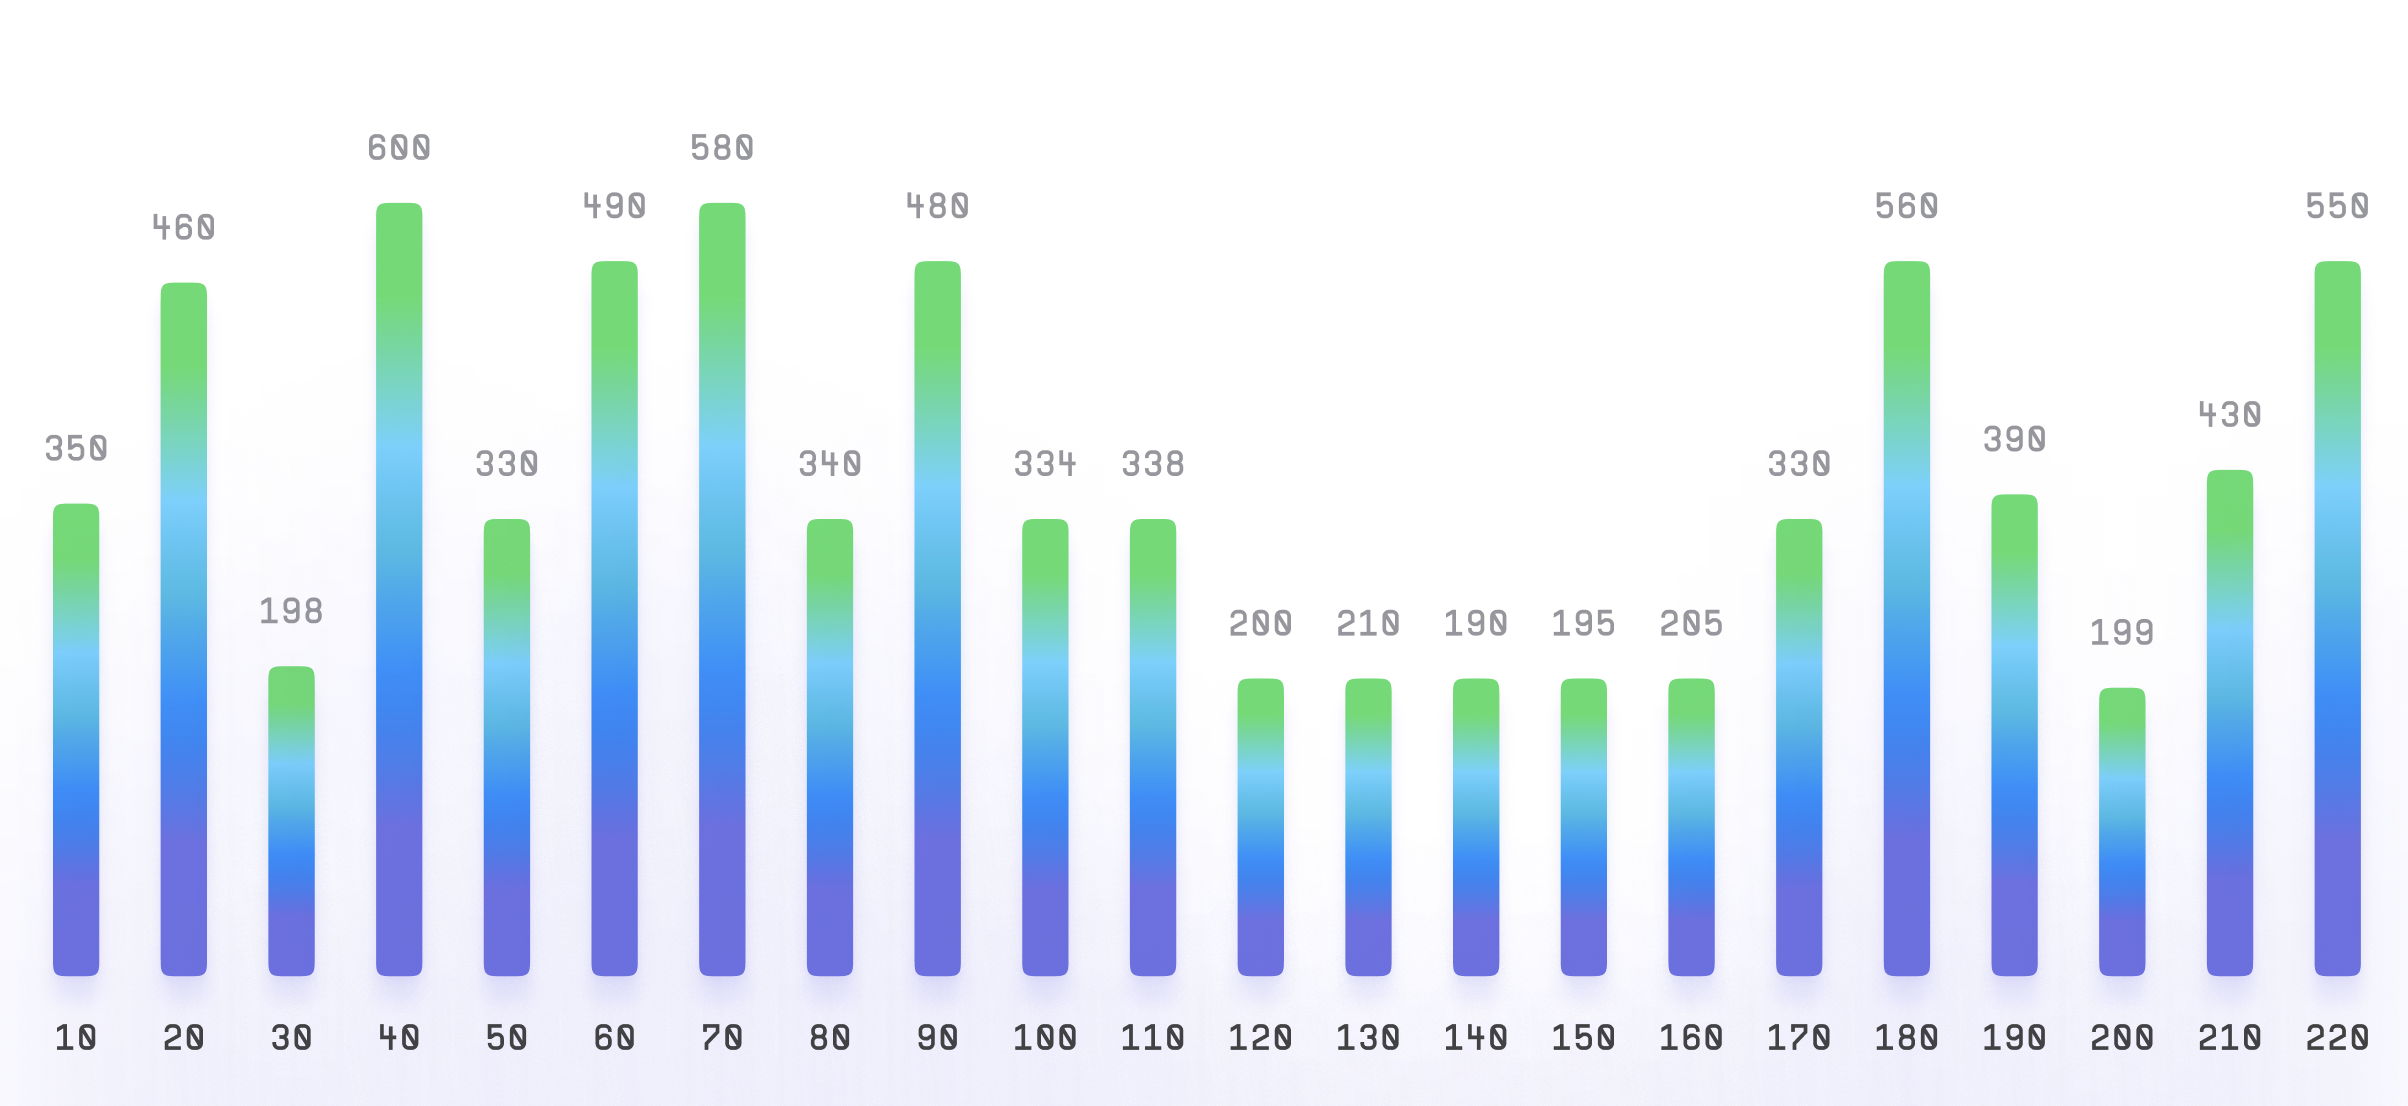
To build a radial histogram, you would typically need one set of data that can be divided into categories or groups.
The data is then divided into bins or intervals, and the frequency of each bin is plotted as a sector of a circle.
The sectors are arranged in a circular pattern, with each sector representing a category or group.
Summary
Radial histograms are commonly used in data visualization to show the distribution of data in a circular fashion.
They are often used in scientific research, engineering, and other fields to visualize data such as wind patterns, ocean currents, and population density.
One advantage of radial histograms is that they can show the distribution of data in a visually striking and intuitive way.
However, they can be less effective when there are too many categories or when the differences between categories are small.
Overall, radial histograms are a useful tool for visualizing data that can be divided into categories or groups, and can be used in a variety of fields to help people understand complex data sets.