Radial Convergence Chart
Radial convergence chart is a type of data visualization tool that represents the convergence, divergence, or similarity of multiple variables. It is useful for analyzing and comparing complex data sets where multiple variables are involved.

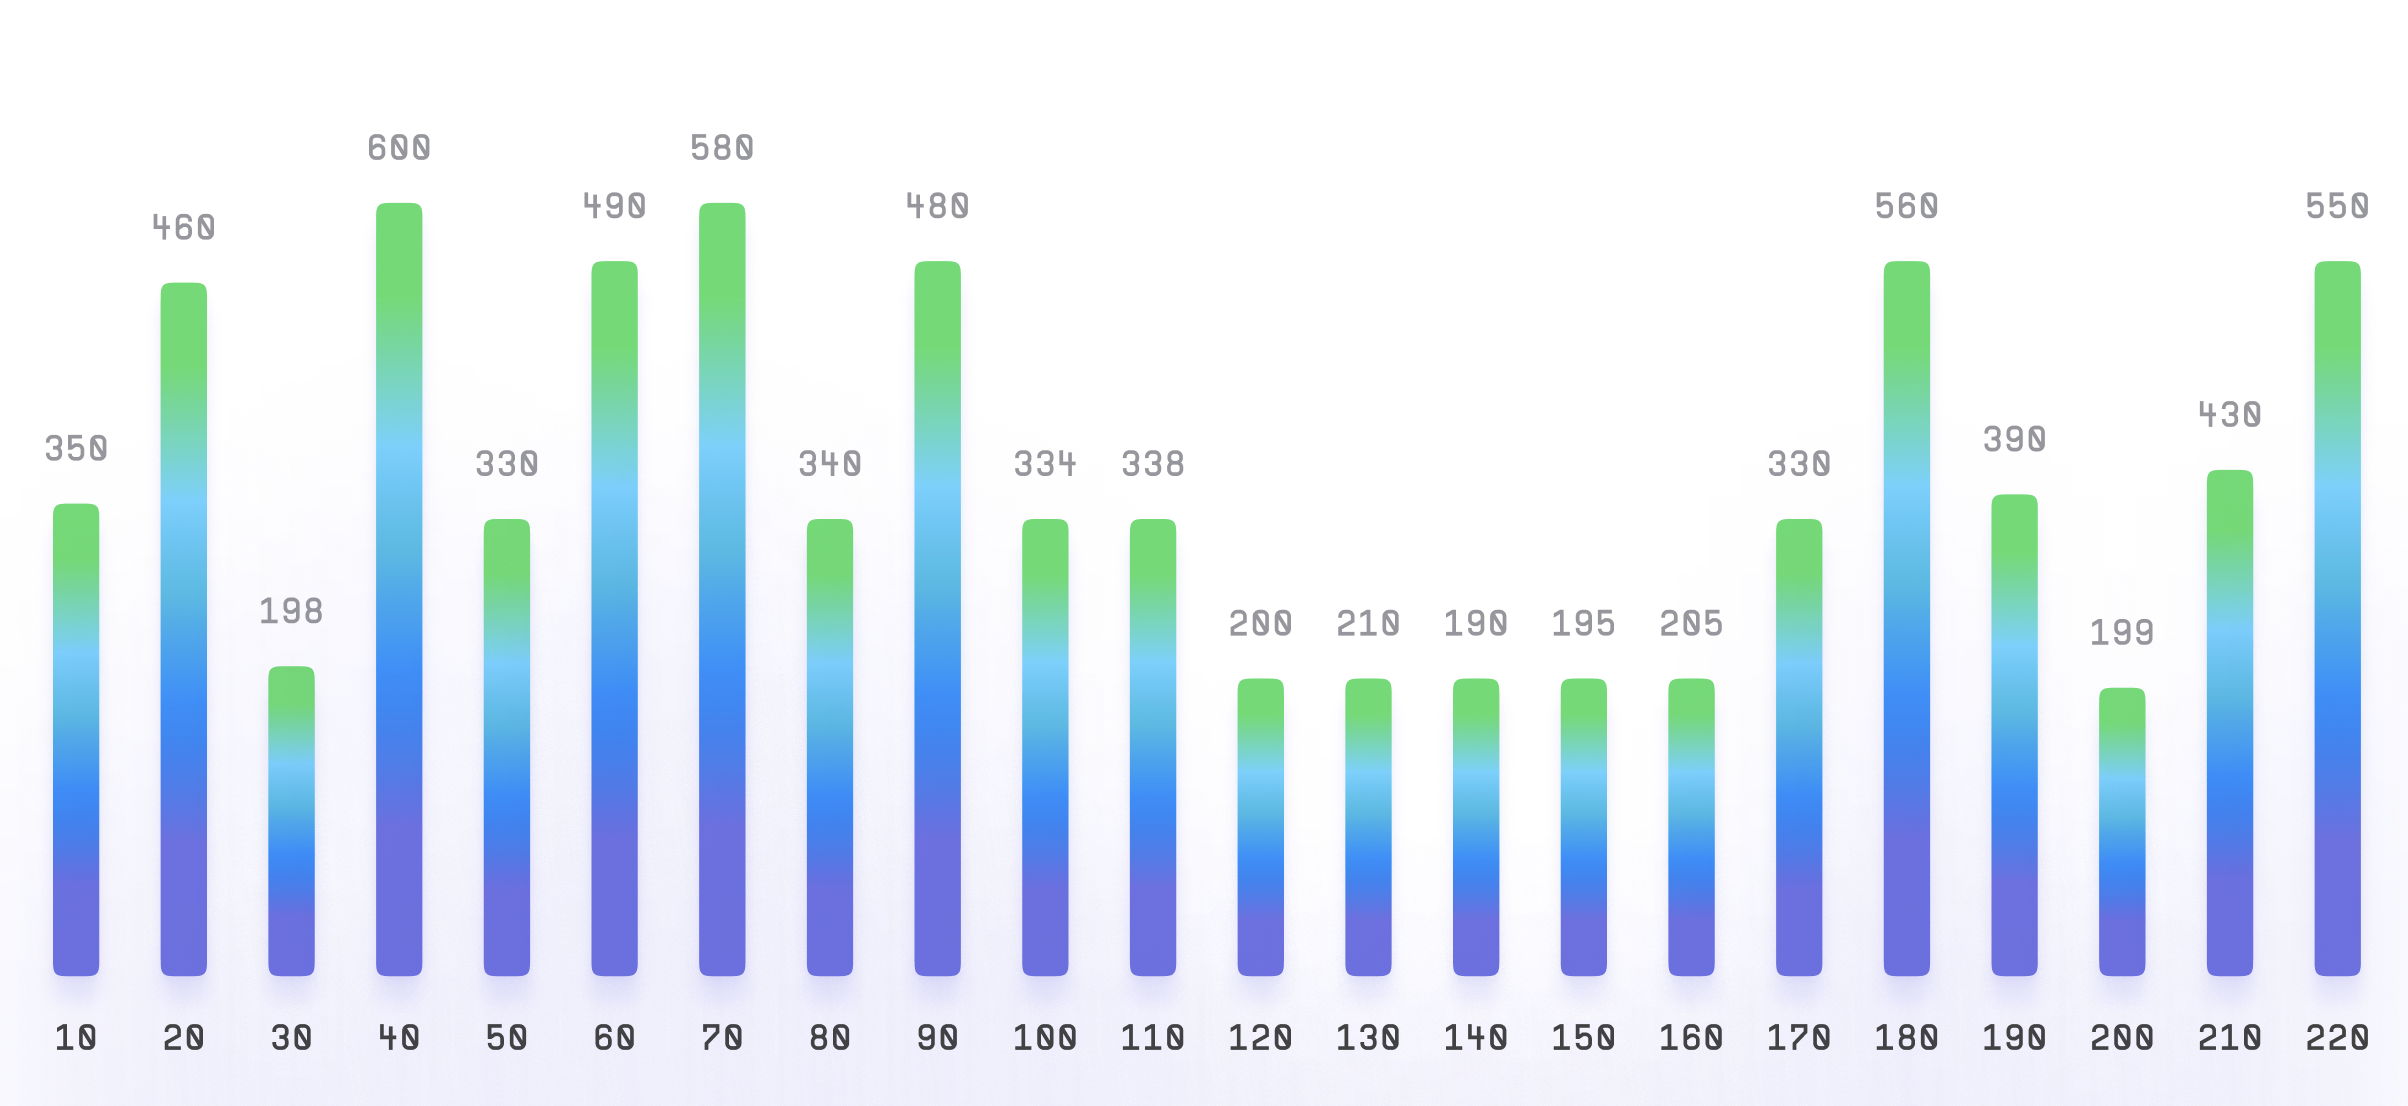
Plotting
The chart is built using a circular or radial axis, where each variable is plotted as a line that starts from the center and extends outwards to the circumference of the circle.
The variables are then connected by a series of arcs or lines, depending on the level of convergence or divergence between them.
Summary
The chart can be used in various fields, including business, finance, economics, and social sciences.
It is particularly useful in market analysis, where it can help identify trends, patterns, and relationships between different variables.
It can also be used to visualize the performance of different products or services, and to compare them based on various metrics.
Overall, the radial convergence chart is an effective tool for visualizing complex data sets and identifying relationships between variables.
It is easy to read and interpret and can provide valuable insights into the data, making it a popular choice among analysts and researchers.